Agoracom Blog Home

Archive for the ‘All Recent Posts’ Category

Advance Gold $AAX.ca – Gold Eyes Further Gains as Rock-Bottom Rates Tempt Investors $SIL.ca $FA.ca $ANG.jo $ABX.ca $NGT.ca $MGG.ca $TECK.ca

Posted by AGORACOM at 5:56 PM on Monday, October 28th, 2019

SPONSOR: Advance Gold AAX.v – Advance Gold controls 100% interest in the Tabasquena Silver Mine in Zacatecas, Mexico. A cluster of 30 Epithermal veins have been discovered, with recent emphasis on exploring a large anomaly to drill. Advance also owns 15% of the Kakamega JV attached to Barrick Takeover Offer for Acacia Mining. Click Here For More Info

This image has an empty alt attribute; its file name is AAX-square-Logo.png

BENGALURU — Fragile global growth and the prospect of interest rates staying lower for longer, boosting gold’s appeal for nervous investors, are behind upward revisions to price forecasts for the yellow metal, a Reuters survey showed.

Spot gold will average $1,402 an ounce in 2019 and $1,537 an ounce next year, according to the median forecasts returned by the poll of 40 analysts and traders in mid-October.

Those numbers are sharply higher than predictions of $1,351 for 2019 and $1,433 for 2020 returned by a similar poll conducted three months ago. Gold has averaged around $1,375 an ounce so far this year.

Gold – traditionally seen as a safe place to invest in uncertain times – hit a more than six-year high of $1,557 in September and with gains of about 17% so far is set for its biggest yearly gain since 2010.

“Rate cuts by major central banks, a deteriorating global economic outlook and elevated geopolitical tensions are the key tailwinds for gold prices,” ANZ analyst Daniel Hynes said.

A U.S.-China trade war has sent a shiver through the global economy.

The U.S. Federal Reserve has meanwhile cut interest rates twice this year to stimulate growth, and other major central banks have followed suit.

Lower rates reduce the opportunity cost of holding non-yielding bullion, making it more attractive to investors.

Central banks have also steadily increased their gold reserves and private cash has flooded into gold-backed exchange traded funds (ETFs), boosting physical demand.

“If central banks and exchange-traded funds keep on buying and the Fed continues with lowering interest rates, we will talk about prices of $1,600 in the near future,” said LBBW analyst Frank Schallenberger.

For silver, poll respondents forecast average prices of $16.24 an ounce this year and $18.13 in 2020, up from predictions of $15.50 and $16.85 three months ago. In the year to date it has averaged $15.97 an ounce.

Silver will remain cheap relative to gold, with the gold/silver ratio averaging 86 in 2019 and 85 in 2020, not far from a more than two-decade high just above 93 reached in July.

Silver in September breached the $19 mark for the first time since 2016. It tends to move with gold, but around half of consumption comes from industry, and weaker economic growth would drag on demand and, potentially, prices.

Gold and silver prices have dipped in recent weeks as signs of progress in trade talks revived appetite for riskier assets. If reached, a trade deal could boost economic growth and hurt gold and silver, said ETF Securities analyst Nitesh Shah.

Speculative bets on price rises for gold on the COMEX exchange have eased slightly from record highs in September, while those for silver have also dipped from a near two-year peak in July. .

High prices have also dampened demand in Asia, the biggest gold-consuming region.

“The main negative factors (for gold) are the speculative overhang in the futures market and the lackluster demand from physical buyers in India, to some extent in China and amongst Western coin and bar purchasers,” said Ross Norman, an independent analyst.

“Gold is due a period of consolidation and perhaps even a temporary correction,” he said.

Source: Reporting by Brijesh Patel in Bengaluru; editing by Arpan Varghese, Peter Hobson and)

Loncor $LN.ca Announces Appointment of Peter Cowley as President and MINECON as Geological Consultants to Advance Ngayu Gold Project $ABX.ca $TECK.ca $RSG

Posted by AGORACOM at 5:37 PM on Monday, October 28th, 2019

Loncor Resources Inc. (“Loncor” or the “Company”) (TSX: “LN”; OTCQB: “LONCD”), a Canadian gold exploration company with significant projects in the Democratic Republic of the Congo (“DRC”) and which is supported by Barrick Gold Corporation (NYSE: “GOLD”; TSX: “ABX”) as joint venture partner and a second major gold producer, Resolute Mining Limited (ASX/LSE: “RSG”), as a 27% shareholder, is pleased to announce the appointment of Peter Cowley as President of the Company and Minecon Resources and Services Limited as geological consultants.

Peter Cowley History of Success in Africa

Mr. Cowley is a geologist with over 40 years’ experience in the minerals industry and a history of major exploration successes in Africa, including the DRC. Among his major accomplishments, Mr. Cowley was Chief Executive Officer and President of Banro Corporation from 2004 to 2008 where he led the exploration that delineated major gold resources at Twangiza and Namoya in the DRC. Prior to joining Banro, Mr. Cowley was Managing Director of Ashanti Exploration, where he led the exploration team in the discovery and development of the Geita mine in Tanzania. Prior to Ashanti, he was Technical Director of Cluff Resources which discovered and developed mines in Zimbabwe, Ghana and Tanzania. He holds an M.Sc from the Royal School of Mines, an MBA from the Strathclyde Business School and is a Fellow of the Institute of Materials, Minerals and Mining. He previously served as Chief Executive Officer and President of Loncor from 2009 to 2015, which will allow him to move rapidly in his new role.

Mr. Cowley commented: “Loncor has a major footprint in the Ngayu greenstone belt in northeastern DRC which has many geological similarities to the Geita and Moto belts which host world class operating gold mines in Tanzania and DRC, respectively, both in terms of size and profitability. Besides the Barrick Joint Venture where the Company has a free carried interest to the pre-feasibility study stage, Loncor has significant gold resources at its KGL-Somituri and Makapela properties where there is significant potential to increase this resource base. I am excited about the opportunity to join up again with Daniel Bansah and his team at MINECON who worked with me previously at Geita and Twangiza/Namoya, to unlock the full potential of the underexplored Ngayu greenstone belt of northeastern DRC.”

Loncor’s Chief Executive Officer, Arnold Kondrat, said: “We are thrilled to have Peter return with a team that has a history of finding gold in Africa, including the DRC. The current NI 43-101 compliant gold resources at our Makapela and KGL-Somituri properties (including Adumbi) at Ngayu, and the potential at our Yindi property, will provide us with an anchor for future development outside of our existing Joint Venture with Barrick Gold on our Ngayu gold project.”

MINECON Appointment

Minecon Resources and Services Limited (“MINECON”) (www.mineconrsl.com) has been appointed by Loncor as geological consultants to manage exploration and development programs at Loncor’s properties within the Ngayu Archean greenstone belt which are outside of Loncor’s Joint Venture with Barrick Gold. MINECON is a full-service mining engineering company headquartered in Ghana, Africa. MINECON works with companies throughout Africa, with a focus on Ghana and DRC mining projects, to support mineral exploration, mining operations, logistics, planning, engineering and geological studies. MINECON’s mining industry professionals have significant DRC-specific experience. The Company believes that the MINECON team, headed by Daniel Bansah (MSc Mineral Exploration) and supported by a team of geological professionals, will provide the needed technical skills and leadership to assist Loncor in advancing its gold properties up the value curve. MINECON will assist Loncor in the continued development of Loncor’s:

  • 100% owned Makapela gold prospect, which has an Indicated Mineral Resource of 614,200 ounces of gold (2.20 million tonnes grading 8.66 g/t Au) and an Inferred Mineral Resource of 549,600 ounces of gold (3.22 million tonnes grading 5.30 g/t Au).
  • 100% owned Yindi gold prospect, which has previously reported drill results including 14.79 metres at 5.11 g/t Au, 19.40 metres at 1.30 g/t Au and 6.20 metres at 4.57 g/t Au.
  • 71.25%-owned KGL-Somituri gold project, which was recently acquired by Loncor (see Loncor’s September 27, 2019 press release) and has an Inferred Mineral Resource of 1.675 million ounces of gold (20.78 million tonnes grading 2.5 g/t Au), with 71.25% of this resource being attributable to Loncor via its 71.25% interest in the KGL-Somituri project.

Makapela, Yindi and KGL-Somituri are all located in the Ngayu gold belt and outside of Loncor’s existing Joint Venture with Barrick Gold on the Ngayu gold belt. Utilizing the expertise and experience of MINECON and under Peter Cowley’s leadership, Loncor seeks to aggressively expand its current gold resources as set out above. 

Audit Committee Clarification
The Company wishes to clarify that as a result of the resignation of a director of the Company, there was a vacancy on the Company’s audit committee from August 17, 2018 to June 17, 2019, such that during this period the audit committee was comprised of only two members and not three as required under National Instrument 52-110. This vacancy was filled on June 17, 2019. The Company’s audit committee is currently comprised of the following three independent directors of the Company: Zhengquan (Philip) Chen, William R. Wilson and Richard J. Lachcik. 

About Loncor Resources Inc.
Loncor is a Canadian gold exploration company focused on two projects in the DRC – the Ngayu and North Kivu projects. Both projects have historic gold production. Exploration at the Ngayu project is currently being undertaken by Loncor’s joint venture partner Barrick Gold (Congo) SARL (“Barrick”). The Ngayu project is 200 kilometres southwest of the Kibali gold mine, which is operated by Barrick and in 2018 produced approximately 800,000 ounces of gold. As per the joint venture agreement signed in January 2016, Barrick manages and funds exploration at the Ngayu project until the completion of a pre-feasibility study on any gold discovery meeting the investment criteria of Barrick. Subject to the DRC’s free carried interest requirements, Barrick would earn 65% of any discovery with Loncor holding the balance of 35%. Loncor will be required, from that point forward, to fund its pro-rata share in respect of the discovery in order to maintain its 35% interest or be diluted. 

Certain parcels of land within the Ngayu project surrounding and including the Makapela and Yindi prospects have been retained by Loncor and do not form part of the joint venture with Barrick. Barrick has certain pre-emptive rights over these two areas. Loncor’s Makapela prospect has an Indicated Mineral Resource of 614,200 ounces of gold (2.20 million tonnes grading 8.66 g/t Au) and an Inferred Mineral Resource of 549,600 ounces of gold (3.22 million tonnes grading 5.30 g/t Au). Loncor also recently acquired a 71.25% interest in the KGL-Somituri gold project in the Ngayu gold belt which has an Inferred Mineral Resource of 1.675 million ounces of gold (20.78 million tonnes grading 2.5 g/t Au), with 71.25% of this resource being attributable to Loncor via its 71.25% interest. 

Resolute Mining Limited owns 27% of the outstanding shares of Loncor and holds a pre-emptive right to maintain its pro rata equity ownership interest in Loncor following the completion by Loncor of any proposed equity offering. Newmont Goldcorp Corporation (NYSE: “NEM”; TSX: “NGT”) owns 7.8% of Loncor’s outstanding shares.

Additional information with respect to Loncor and its projects can be found on Loncor’s website at www.loncor.com.

LOMIKO Metals $LMR.ca Building America’s Mine to Battery to EV Supply Chain $CJC.ca $SRG.ca $NGC.ca $LLG.ca $GPH.ca $NOU.ca

Posted by AGORACOM at 3:40 PM on Monday, October 28th, 2019

SPONSOR: Lomiko Metals LMR:TSX-V – A Canadian exploration-stage company discovered high-grade graphite at its La Loutre Property in Quebec and is working toward a Pre-Economic Assessment (PEA) that will increase its current indicated resource of 4.1 Mt of 6.5% Cg to over 10 Mt of 10%+ Cg through a 21 hole program at the Refractory Zone. Click Here For More Information

In 2010 the US Department of Energy’s Critical Materials Strategy included lithium as one of 14 elements expected to play a vital role in America’s clean energy economy. 

Lithium is also among 23 critical metals President Trump has deemed critical to national security; in 2017 Trump signed a bill that would encourage the exploration and development of new US sources of these metals.

According to the US Geological Survey, the United States last year imported around half of 48 minerals and 100% of 18 minerals.

According to Benchmark Mineral Intelligence the US only produces 1% of global lithium supply and 7% of refined lithium chemicals, versus China’s 51%.

A Tesla executive earlier in the year said the company is worried about a shortage of lithium. The number of EVs are expected to multiply in coming years, but they can only progress as fast as the lithium-ion batteries can get built that go into them. Tesla CEO Elon Musk said, in June of 2019, that in order to ensure Tesla has enough batteries to expand its product line Tesla might get into mining lithium for itself.

The world’s leading lithium battery companies in 2016 produced 29 gigawatt-hours (GWh) of batteries. By 2028 forecasted production is expected to hit 1,049 GWh, an increase of 3,516%! 

Consider that in 2018, China sold 1.182 million NEVs (new energy vehicles including electrics and hybrids), 520,000 or 78% more than in 2017.

As China’s mark on the lithium market becomes more pronounced, growth in the sale of lithium end products is taking off.

According to Adamas Intelligence, in February 2019, 75% more lithium carbonate was deployed for batteries in electric and hybrid passenger vehicles compared to February, 2018.

At Ahead of the Herd we know that the lithium market, in a few short years, is going to be in deficit as troubles ramping up production meet a mounting wall of demand. It’s obvious Tesla’s CEO understands that in order to grow his company he has to have a secure supply of lithium.

Lithium price explainer

Before we go any further let’s take a look at the different prices of lithium; with 11 lithium products currently being assessed, it can get confusing. While the mineral used to be priced in long-term contracts like uranium, recently there has been a push by end-users, particularly automotive manufacturers, for more price transparency. 

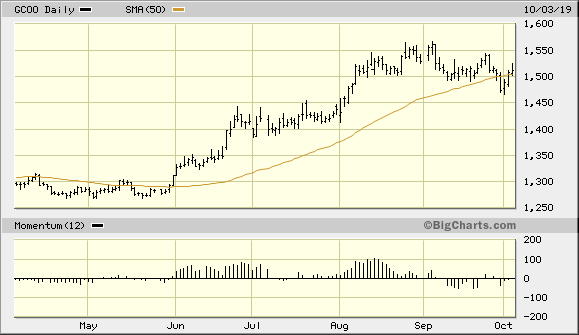
As we can see in the price chart below, short-term the lithium bears have the upper hand, with lithium prices falling in China and South America, along with the price of spodumene concentrate in Australia. 

How are prices determined? There are three factors Benchmark Mineral Intelligence uses to set the industry standard reference prices: quality/ grade of lithium, shipping costs/ volumes, and the reliability of information given. 

The grade and level of impurities affect the price a miner receives, for the lithium to be processed into spodumene concentrate, lithium carbonate or lithium hydroxide. Often the product is refined into the exact specifications required by the end-user.  

Currently there are six prices of lithium carbonate, four for lithium hydroxide and one spodumene concentrate price: 

  • Benchmark Minerals, Lithium Carbonate, 99%, FOB South America, USD/tonne
  • Benchmark Minerals, Lithium Carbonate, 99%, CIF North America, USD/tonne
  • Benchmark Minerals, Lithium Carbonate, 99.2%, CIF Europe, USD/tonne
  • Benchmark Minerals, Lithium Carbonate, 99.2%, CIF Asia, USD/tonne
  • Benchmark Minerals, Lithium Carbonate, Battery Grade, 99.5%, EXW China, RMB/tonne
  • Benchmark Minerals, Lithium Carbonate, Technical Grade, 99%, EXW China, RMD/tonne
  • Benchmark Minerals, Lithium Hydroxide, 55%, FOB North America, USD/tonne
  • Benchmark Minerals, Lithium Hydroxide, 56.5%, CIF Asia, USD/tonne
  • Benchmark Minerals, Lithium Hydroxide, 55%, CIF Europe, USD/tonne
  • Benchmark Minerals, Lithium Hydroxide, 56.5%, EXW China, RMB/tonne
  • Benchmark Minerals, Spodumene Concentrate, 6%, FOB Australia

In July Benchmark Intelligence published an update on lithium prices titled ‘Lithium’s price paradox’. Current prices are a paradox because lithium investors are making decisions based on short-term supply versus long-term market fundamentals. 

Indeed there has been an influx of new supply entering the market. Last year four hard-rock (spodumene) operations in Australia started production. The number of active lithium mines in Australia grew from one in 2016 to nine by year-end 2018. 

A total of five new lithium conversion plants (plants that convert lithium carbonate to lithium hydroxide) have come into production and another three have expanded their output to meet market demand.

What is promised in not always delivered

Past success however is not necessarily indicative of the future. We know that between 2012 and 2016, major lithium miners planned to produce an extra 200,000 tonnes of new supply. But when 2016 rolled around, under 50,000 new tonnes came online, due to technical problems.

According to Benchmark’s research, only three plants in China have reached production and full capacity. Beyond the Tier 1 producers shown in green in the table below, just two – General Lithium (16,000t) and Jiangte Motor (25,000t) – managed to meet production targets of 41,500t. That means only 87,000t of new Chinese capacity has hit the market since 2016, of a planned 481,500t:

The false narrative which emerged from these expansions and spilled over into 2019 was that the industry was awash with battery-grade lithium chemicals, sufficient to support rapid electrification over coming years.

Benchmark notes more major expansions outside China are planned this year but the timelines for completion are vague and delays are expected; thus the myth of over-supply in the face of exponentially high future demand for lithium. The research firm predicts supply would have to increase at a compound annual growth rate (CAGR) of 19% over the next six years to meet 2025 demand. From 2015 to 2018 it grew at just 11%: 

While the supply response has addressed the relatively minor growth of today, it is still far from meeting the needs of tomorrow’s EV expansions.

Spectators that flocked to the market in 2016 on the promise of an EV super-cycle have left before the warm up, let alone the main event.

While a downturn in prices has reflected a necessary correction towards near-term market fundamentals, it fails to represent the increasing possibility of another major deficit in the market by the early-2020s, creating a deceptive narrative in both share prices and surrounding markets. 

Another important point is that, despite the hundreds of thousands of tonnes more lithium chemical production capacity, only a small percentage will make it into lithium-ion batteries. Why?

Lithium carbonate contained in brines must have contaminants removed before it can be considered battery-grade quality; the process of removing impurities can be expensive. 

Technical-grade lithium used in applications other than for EV batteries such as glass and ceramics, is cheaper than battery-grade material, but it has to have low concentrations of iron to be upgraded. There may also be teething problems at new operations. Says Benchmark: 

As with any new lithium chemical production, only a proportion of this material will likely be sold into the battery sector from the outset. Even leading producers have problems meeting specs in the initial stages of production.

Both lithium carbonate and hydroxide can be used in the EV battery cathode. Lithium for the cathode and electrolyte materials is produced from lithium carbonate. In brine deposits, the lithium chloride is concentrated by evaporating lithium-rich brines in shallow pools from 12 to 18 months. It is then treated with sodium carbonate (soda ash) to precipitate out the lithium carbonate. 

Lithium carbonate can also be produced from clay deposits and spodumene, a silicate of lithium and aluminum.

All lithium batteries contain some form of lithium in the cathode and electrolyte materials. The battery anode is generally graphite-based, containing no lithium. 

Lithium carbonate derived from brine operations can be used directly to make lithium-ion batteries, but a hard-rock, spodumene concentrate needs to be further refined before it can be used in batteries, adding costs and complexity.

Despite being more expensive lithium hydroxide is becoming more popular as a battery feedstock because it is said to produce cathode material more efficiently and is necessary in certain cathode combinations such as nickel-cobalt-aluminum (NCA) oxide batteries and nickel-manganese-cobalt (NMC) oxide batteries. 

About 75% of the 65,000 tonnes of lithium chemical production expected to come online this year is targeting lithium hydroxide. 

While brine operations that suck up the lithium in a salt-water solution and then evaporate it in large ponds have historically been cheaper than hard-rock spodumene operations like Greenbushes in Australia, that is beginning to change. A higher royalty structure in Chile and a plant’s ability to make lithium hydroxide directly from spodumene are two factors challenging this assumption. 

But according to Benchmark, the case for lithium hydroxide being the more competitive lithium-ion battery feedstock is predicated on the battery market adopting high-nickel, hydroxide-dependent cathode chemistries” (a proposition that looks increasingly unlikely in the near-term) and secondly, that all spodumene producers are integrated lithium chemical suppliers. So far none of the new lithium assets are owned by chemical converter companies: 

The question in the lithium market is no longer whether spodumene or brine resources will be developed – both are needed to take us anywhere near the growth estimates of the next 2-3 years. The new questions is what other channels of supply will be developed to take us close to the demand forecasts for 2025 and beyond.

Indeed if these new spodumene mines fail to meet production costs, they will either cut output or close, which would tighten the lithium market even further than expected. Already we are seeing some spodumene producers in Australia balk at the prices they are currently receiving, preferring to stockpile material instead.

Reuters reportsConverters of hard rock lithium into battery chemicals in China were holding around four months’ worth of stocks, or double usual levels… This has slowed sales from overseas suppliers. Galaxy sold 44,630 tonnes in the first half of 2019, against more than 90,000 tonnes a year earlier, at an average price of $584, down from $940 a year ago.

If Australia’s spodumene producers are priced out of the market, where would the lithium come from to meet surging market demand? 

The way things are going, it’s not likely to be the United States. Despite having several properties at the development stage, no new lithium mine has entered production on US soil for over 50 years. The only producing mine is Albemarle’s Silver Peak in Nevada – which has been going since the 1960s and is rumored to have falling lithium brine concentrations.  

China resource lock-up 

We know from previous articles that China has been extremely active in acquiring ownership or part-ownership of foreign lithium mines and inking offtake agreements. 

By 2025, the Chinese government wants EVs to represent 20% of all cars sold.

By comparison, the US sold 361,307 EVs in 2018, just under a third of China’s volume.

China of course, has also locked up the rare earths market and is the primary player in a number of critical mineral markets including cobalt, graphite, manganese and vanadium. 

For years the United States and Canada didn’t bother to explore for these minerals and build mines. Globalization brought with it the mentality that all countries are free traders, and friends. Dirty mining and processing? NIMBY. Let China do it, let the DRC do it, let whoever do it.

China recognized opportunity knocking and answered the door, seizing control of almost all REE processing and magnet manufacturing, in the space of about 10 years.

Earlier this year, as part of its trade war strategy, China raised the prospect of restricting exports of these commodities, that are critical to America’s defense, energy electronics and auto sectors.

Over half of the world’s cobalt – a key ingredient of electric vehicle batteries – is mined as a by-product of copper production in the Democratic Republic of Congo (DRC). In a $9 billion joint venture with the DRC government, China got the rights to the vast copper and cobalt resources of the North Kivu in exchange for providing $6 billion worth of infrastructure including roads, dams, hospitals, schools and railway links.

China controls about 85% of global cobalt supply, including an offtake agreement with Glencore, the largest producer of the mineral, to sell cobalt hydroxide to Chinese chemicals firm GEM. China Molybdenum is the largest shareholder in the major DRC copper-cobalt mine Tenke Fungurume, which supplies cobalt to the Kokkola refinery in Finland. China imports 98% of its cobalt from the DRC and produces around half of the world’s refined cobalt.

In 2018 the United States produced just 500 tons of cobalt compared to 90,000t mined in the DRC. The US did not produce any vanadium either; the top three producers of the steel additive are, in order, China, Russia and South Africa.

As Quartz notes, in order to maintain its dominance in the EV market, Chinese manufacturers need a lot of cheap lithium. That explains why its largest lithium miner, Tianqi Lithium, owns 51% of Australia’s Greenbushes spodumene mine – the world’s dominant hard-rock lithium mine. And why China bid for, and got, a 23.7% stake in Chilean state lithium miner SQM, the second largest in the world, for $4.1 billion.

China produces roughly two-thirds of the world’s lithium-ion batteries and controls most of its processing facilities. 

Russia goes after lithium

This week the Uranium One Group, a subsidiary of Rosatom, Russia’s state-owned nuclear company, signed a deal with Wealth Minerals (TSX-V:WML) which has a lithium property in northern Chile. The Vancouver-based junior sold 51% of its Atacama lithium project to U1G. 

It’s unclear what Uranium One – the same company at the center of a scandal involving the Clintons – plans to do with the 42,600-hectare property. WML would only say it’s interested in partnering with U1G to “accelerate the development of lithium projects by using modern technology and moving away from outdated solar evaporation to a more efficient and environmentally friendly sorption technology,” the company’s president, Tim McCutcheon, remarked in Monday’s news release.

We do know that Russia is paying more attention to electric vehicles, despite petroleum being its number one export by far. According to the Russian Ministry of Industry and Trade, EV sales in the largest cities particularly Moscow and St. Petersburg, grew 150% between 2017 and 2018, despite a 40% price increase. 

The most popular model is the Nissan Leaf, accounting for some 40% of all sales in 2018, followed by the Mitsubishi i-MiEV and the Tesla Model S. Minister of Energy Alexander Novak reportedly said that EVs should represent 8-10% of Russia’s total car fleet by 2025- which would be a huge increase from the 10,000-11,000 EVs estimated to be on Russian roads at the end of 2018, Automotive Fleet reported earlier this year. 

It’s certainly curious, if not alarming, that Russia is already locking up lithium supplies, even though its EV penetration rate is paltry compared to the top electric vehicle use countries. Canada for example has about eight times more. 

We can’t help but notice Uranium One is doing the same thing with lithium, that it has done with uranium – be the Russian government’s Trojan horse in dominating the world’s uranium supply

Is it possible that Russia wants to be a price-setter of lithium too, which even in oil and gas-soaked Russia is likely to be a major new growth industry? It’s easy to see offtakes developing between Russia and South American lithium brines, or maybe Russia partnering with Chinese companies as they have done in the energy sphere, as the country ramps up production of lithium batteries and electric vehicles. 

A run through the latest uranium mine closures reveals the strong likelihood that Russia, through its Kazakhstan proxy, aims to seek and destroy any threats to its dominance. Besides Cameco’s mine shutdowns and US uranium production controlled by Americans reduced to almost nil, other casualties of low U prices and high-cost mining include French state-owned nuclear juggernaut Areva. West Africa-focused Areva went bankrupt and had to be restructured into a new company, Orano.

Australia’s Paladin Energy placed its Langer Heinrich mine in Namibia on care and maintenance in May 2018, following the mothballing of its Kayelekera mine in Malawi.

Rio Tinto’s Rossing uranium mine in Namibia is an example of a high-cost mine that was carved up by the Russians and handed over to the Chinese. The world’s longest-running open-pit uranium mine, opened in 1976, produced the most uranium of any mine. However, with production costs over $70 per pound, and the uranium price still limping along at around $20/lb, it was only a matter of time before too much red ink had spilled; in November 2018, Rio agreed to sell its stake in Rossing to China National Uranium Corp. 

With their low-cost production and state-owned enterprises doing the mining and enriching, Russia, Kazakhstan, and upcoming China can easily out-compete the private uranium industry. 

For example Uranium One, the Canadian company that was swallowed up in 2013 by ARMZ, a subsidiary of Rosatom, currently mines uranium in Kazakhstan, the world’s leading uranium-producing country, at an average cash cost of $8 a pound. In-situ mines operated by Uranium One and Kazatomprom dominated the first two quartiles of uranium-mining costs in 2018.  

In contrast Cameco, the third-biggest uranium miner behind Kazakh state-owned Kazatomprom and Orano (formerly Areva), reports its only mine left after four closures, Cigar Lake, will be mined at $15-16/lb over the remainder of its life. 

Uranium One is vitally important not only to Kazakhstan’s uranium production, but Russia’s. 

As a wholly-owned subsidiary of Rosatom, the company is responsible for Rosatom’s entire uranium production outside of Russia. That makes it the world’s fourth largest uranium producer. Uranium One has part-ownership of six producing uranium mines in Kazakhstan, the Willow Creek mine in Wyoming, and a 13.9% interest in a uranium development project in Tanzania.  

Russia and Kazakhstan have signed several nuclear cooperation agreements over the past decade or so. 

The former Soviet satellite nation and Russia currently account for over a third of US imported uranium, effectively setting the price of the nuclear fuel.  

US mine to battery to EV supply chain

The International Energy Agency is predicting 24% growth in EVs every year until 2030. The global fleet is expected to triple by 2020, from 3.7 million in 2017 to 13 million in 2020, according to the IEA.

Bloomberg forecasts there will be a 54-fold increase in EVs between 2017 and 2040, when global light-duty EV sales are expected to hit 60 million; there are currently about 4 million EVs in the world.

Globally, battery makers and automobile manufacturers are scrambling to ensure they have enough supply of the silvery-white metal.

Reuters analysis shows that automakers are planning on spending a combined $300 billion on electrification in the next decade.

Volkswagen has said it will invest $800 million to construct a new electric vehicle – likely an SUV – at its plant in Chattanooga plant, starting in 2022. For more read Volkswagen to drag Tesla, making EVs in Tennessee.

Opened in 2016, Tesla’s Gigafactory in Nevada is a going concern. Every day 1,000 cars sets are trucked from the Gigafactory to an assembly plant in Fremont, California. The three-storey structure, the size of a dozen football fields, has 13,000 people working for Tesla and its Japanese battery partner, Panasonic. 

The company’s Model 3 was the best-selling electric vehicle in the US during the first half of 2019. InsideEVs claims Tesla sold 67,650 Model 3s through June, seven times the next best-selling electric vehicle, Tesla’s Model X SUV. The Chevy Bolt and Nissan Leaf were also among the top five best sellers. 

GM is planning to sell its first EV this year, a 2020 Cadillac SUV, built in Spring Hill, Tennessee, in a move designed to challenge Tesla.

In 2017, coinciding with its 20th anniversary, Mercedez-Benz announced plans to set up an electric car production facility and battery plant at its existing Tuscaloosa, Alabama plant. The $1-billion expansion will include a new battery factory near the production site, with the goal of providing batteries for a future electric SUV under the brand EQ. Six sites are planned to produce Mercedes’ EQ electric-vehicle family models, along with a network of eight battery plants. 

Meanwhile more battery factories are being built, driven by the demand for lithium ion batteries which is forecast to grow at a CAGR of over 13% by 2023.

There are 68 lithium-ion battery mega-factories already in the planning or construction stage. The first phase of Tesla’s Chinese Gigafactory is reportedly almost complete; plans are also in the works for a Gigafactory in Europe

Korean company SK Innovation has said it will invest US$1.6 billion in the first electric vehicle battery plant in the United States, and is considering plowing an additional $5 billion into the project, planned for Jackson County, Georgia.

All of this explosive growth in battery plants and EVs will mean an unprecedented demand for the metals that go into them. This includes lithium, cobalt, rare earths, graphite, nickel and copper. Lithium for example is expected to see a 29X increase in demand according to Bloomberg.

How will the United States obtain enough lithium for the electric-vehicle storm of demand that is brewing?

The US only produces 1% of global lithium supply and 7% of refined lithium chemicals, versus China’s 51%. The country is about 70% dependent on imported lithium. 

To lessen US lithium dependency will require the building of a mine to battery to EV supply chain in North America.

The first step is to develop new North American lithium mines.

Lithium products from Albemarle’s Silver Peak brine operation in Nevada are sent to its processing plant in North Carolina. This material is then loaded on ships and sent to Chinese battery manufacturers, which sell the batteries to automakers.

We don’t know how much lithium hydroxide Albemarle exports from Kings Mountain (the company does not disclose the amount to the USGS in tabulating global production statistics), but we do not think it is significant in global terms. According to Visual Capitalist, Silver Peak only produces 1,000 tonnes per year of lithium hydroxide, within a current lithium market of roughly 280,000 tonnes per annum of lithium carbonate equivalent (LCE), a term that encompasses both lithium hydroxide and carbonate used in EV batteries.

Recently, oil-field services giant Schlumberger inked an earn-in agreement with Pure Energy Minerals that could see Schlumberger – normally associated with oil and gas operations – own a lithium brine project in Nevada. The company and its subsidiaries have three years to acquire 100% ownership in return for constructing a pilot plant for processing lithium brine. 

Lithium Americas (TSX-V:LAC) is advancing its Thacker Pass lithium project in Humboldt County, Nevada, about 100 km northwest of Winnemucca. In 2018 LAC completed a PFS that envisions an open-pit mine that would produce 60,000 tonnes per annum of lithium carbonate, for 46 years. The two-phase project, targeted for 2022, would start with 30,000 tonnes per annum (tpa) then ramp up to 60,000 tpa. The company recently said it has completed a Plan of Operation for submission to the Bureau of Land Management (BLM), secured two partners for mining engineering, and started a definitive feasibility study (DFS). 

Juniors: the next wave  

Junior miners that have projects anywhere close to production between now and 2040 are bound to do well in the current lithium market, which as mentioned, is facing long-term supply shortages, despite what you read about a glut. 

Remember, supply would have to increase at a CAGR of 19% over the next six years to meet 2025 demand. 

Albemarle’s Silver Peak mine is the only producing lithium mine in the US, but there are other properties that could become the next big producer. The old adage, “To find a mine look around a mine” applies here. Below are five companies with US-focused lithium projects under development. All are in Tesla’s home state Nevada.

Ioneer (ASX:INR). Ioneer’s Rhyolite Ridge project is a shallow lithium-boron deposit located 25 kilometers from Albemarle’s Silver Peak mine. The company plans to leach lithium and boron from the host rock using dilute sulfuric acid. The project currently has a mineral resource of 4.1 million tonnes lithium carbonate and 10.9Mt of boric acid. With the resource compiled from an estimated 20% of two prospective basins, Ioneer believes it can expand the resource through further drilling. A prefeasibility study (PFS) was completed in October 2018. 

Cypress Development Corp (TSX-V:CYP). Cypress’ Clayton Valley Lithium Project, next to Albemarle’s Silver Peak lithium mine, hosts a non-hectorite claystone indicated resource of 3.835 million tonnes LCE and an inferred resource of 5.126 million tonnes LCE. A 2018 PEA showed a net present value of $1.45 billion at an 8% discount rate, yielding an internal rate of return (after tax) of 32.7%. Payback is just under three years. Cypress has successfully produced lithium carbonate and lithium hydroxide that can be marketed to end users, like electric vehicle battery manufacturers. Metallurgical testing shows 83% lithium recovery. A Pre-feasibility Study (PFS) is expected in October 2019.

Noram Ventures (TSX-V:NRM). The perimeter of Noram’s claims are located within two kilometers of Albemarle lithium brine operations. A technical report on the Zeus claim block was updated earlier this year, the result of three phases of drilling encompassing 60 drill holes. The new report identified an inferred mineral resource of 1.5 million tonnes of lithium carbonate equivalent (LCE).

Nevada Energy Metals (TSX-V:BFF). Nevada Energy Metals acquired its BFF-1 lithium project based on descriptions of geological modeling and historical drill results. The 2008 report concluded that shallow thermal-gradient drilling and exploration by previous operators demonstrated that this particular part of the Clayton Valley contained the valley’s highest subsurface temperatures. The company has two other lithium properties in Nevada, Teels Marsh West located 77 km northwest of the Silver Peak mine, and Black Rock Desert, which it optioned to LiCo Energy Metals in 2016. 

LiCo Energy Metals (TSX-V:LIC). LiCo Energy Metals is advancing the Black Rock Desert project it acquired from Nevada Energy Metals. Under the option agreement, LIC can earn a 70% interest in the project, and a 3% net smelter return royalty, by spending $1,250,000 in exploration within three years. A soil sampling program of 88 samples returned 73 samples containing over 100 ppm lithium, with maximum values up to 520 ppm Li.

Conclusion

This brief survey of lithium juniors operating in the United States shows there is tons of potential for building the foundation of a true mine to battery supply chain right here in North America. Doing so would put an end to US import dependence on foreign suppliers of lithium, needed to serve the burgeoning electric vehicle industry; the shift that occurred in the US oil industry, from net importer to net exporter, is analogous to what could, and should, happen with lithium.

The only way to break this dependence is to develop lithium mines in the US. And that spells opportunity for ahead of the herd investors.

Consider – Bacanora Minerals Sonora clay lithium project in Mexico attracted a buy-in from China’s Ganfeng Lithium. A payment of £21,963,740 from Ganfeng in exchange for a 29.99% equity interest and a 22.5% joint venture (JV) investment, helped boost Bacanora’s share price by over 50% this year. 

Battery and EV manufacturers in the United States need to get out in front of the looming lithium supply shortage. Buy secure mine supply now or pay the pipers, Russia and China, later.

Richard (Rick) Mills https://aheadoftheherd.com/Newsletter/2019/Building-Americas-mine-to-battery-to-EV-supply-chain

American Creek $AMK.ca Reports Significant Drill Results Including 2 g/t Gold over 87 Meters Within a Near-Surface Intercept of 1 g/t Gold over 336 Meters and 0.7 g/t over 826.5 Meters at Treaty Creek in the Golden Triangle $TUD.ca $SII.ca $GTT.ca $AFF.ca $SEA.ca $SA $PVG.ca

Posted by AGORACOM at 9:19 AM on Monday, October 28th, 2019
  • The results from the most recent 5 holes confirm that all 23 holes drilled in the last two years have intersected significant mineralization and dramatically increased the size of the Goldstorm deposit
  • Hole GS19-49 was drilled to 960.1 m, at -80° dip, on Section 111+00 NE next to the previously announced vertical hole GS19-48, which yielded 0.725 g/t Auover 838.5m, including an upper horizon that averaged 1.048 g/t gold Au over 328.5 m. Hole GS19-49 returned equally
  • impressive results with a comparable 0.7 g/t Au over 826.5 m and the upper horizon averaging 1 g/t Au over 249 m. 

Cardston, Alberta–(Newsfile Corp. – October 28, 2019) – American Creek Resources Ltd. (TSXV: AMK) (OTCBB: ACKRF) (the “Company” or “American Creek“) is pleased to announce additional significant drill results from the Goldstorm Zone at the Treaty Creek JV Project. The results from the most recent 5 holes confirm that all 23 holes drilled in the last two years have intersected significant mineralization and dramatically increased the size of the Goldstorm deposit, leading strategic investor Eric Sprott to again re-emphasize the potential of the project in last Friday’s podcast where he stated that he is “hoping they can prove up a 20-million-ounce deposit”. The results of the latest 5 holes are reported below.

Darren Blaney, American Creek’s CEO, stated:Having Ken Konkin, the geologist credited for the discovery and development of Pretium’s neighbouring Brucejack Mine head the exploration program this year has been a tremendous success. His knowledge, experience, and past success in this same hydrothermal system is advancing the Goldstorm zone to potentially becoming a world-class deposit with far better logistics than the neighbouring KSM deposits.

As Tudor Gold CEO Walter Storm correctly pointed out, the Goldstorm “is open in all directions” which correlates with and is confirmed by the geophysics conducted on the property. The Goldstorm now has the attention of several major industry players and we expect that future results will continue to impress as we further define this potential world-class deposit.”

SUMMARIZING THE 2019 PROGRAM

The Company’s JV partner, Tudor Gold’s 2019 exploration program at the Goldstorm Zone on Treaty Creek totalled 9,781.8 meters with 14 diamond drill holes. This year’s drilling program generated the best near-surface results attained to date on the project. Specifically, in addition to several hundred meters extension along strike to the northeast, the 2019 program significantly expanded the mineralized limits to the southeast, where one of the best near-surface intervals averaged 2 g/t Au over 87m, within 336 m averaging 1 g/t Au in hole GS19-52.

RESULTS OF THE FINAL 5 DRILL HOLES

  • Hole GS19-49 was drilled to 960.1 m, at -80° dip, on Section 111+00 NE next to the previously announced vertical hole GS19-48, which yielded 0.725 g/t Au over 838.5m, including an upper horizon that averaged 1.048 g/t gold Au over 328.5 m. Hole GS19-49 returned equally impressive results with a comparable 0.7 g/t Au over 826.5 m and the upper horizon averaging 1 g/t Au over 249 m 
  • Along the same section, hole GS19-52 (-50° dip at 115° azimuth) was drilled much longer than expected because the Goldstorm System continues at least 700 m to the southeast ; GS19-52 averaged 1 g/t gold over 336 meters with a higher grade core of 2 g/t gold over 87 meters within the upper horizon.

Tudor Gold Exploration Manager, Ken Konkin explained: “Clearly the results of the previously reported deep vertical step-out holes demonstrate the impressive size and grade consistency of the Goldstorm system. Within the overall mineralized package of fragmental intermediate volcanic rocks there are several sub-horizontal horizons of significantly higher gold grades. The uppermost portions of the previously reported holes GS19-42, GS19-47 and GS19-48 contained respectively, 1.268 g/t gold over 252 m, 0.828 g/t gold over 301.5 m and 1.048 g/t gold over 328.5 m. We now have several other drill holes with excellent near-surface gold values to add to this list of growing intercepts. GS19-52 has returned the highest core gold grades of 2.006 g/t Au over 87 m within a 336m intercept of 1.004 g/t Au.

These intercepts are part of the uppermost portion of the Goldstorm system which we refer to as the ‘300 Horizon’. The ‘300 Horizon’ remains open along strike to the northeast as well as to the southeast. In addition, the lower horizons of the Goldstorm system also remain open in all directions and the lowest horizon is open at depth.”

Furthermore, Mr. Konkin added: “We are seeing consistent silver and copper mineralization associated with the deeper gold horizons such as the previously reported 151.5 m zone of 0.572 g/t gold, 8.5 g/t silver and 0.21% copper that was intercepted from 665.0 to 816.5 m in GS19-47 and a 66.0 m zone with 0.958 g/t gold, 3.9 g/t silver and 0.35% copper, whichwas intercepted from 874.5 to 940.5 m in GS19-48. Similarly, we have now seen in GS19-49, a 78 m intercept averaging 1.145 g/t gold, 11.2 g/t silver and 0.21% copper (750-828 m) and in GS19-52 an 88.5 m interval averaging 0.352 g/t gold, 9.3 g/t silver and 0.25% copper (515-603.5 m). Not only does the Goldstorm Zone remain open at depth and along strike, we are now seeing base-metal associations possibly as part of a zonation within the hydrothermal system.”

The final three footwall extension holes (GS19-50, GS19-51 and GS19-53) were completed on section 110+00 NE. These were successful in extending the width of the mineralized zone to the southeast:

  • Hole GS19-50 returned an average of 0.602 g/t Au over 577.5 m including 0.811 g/t Au over 267.0 m in the ‘300 Horizon’.

  • Hole GS19-51 returned an average of 0.721 g/t Au over 246 m in the ‘300 Horizon’ and a lower horizon that averages 1.017 g/t Au over 40.5 m.

  • Hole GS19-53 returned an average of 0.984 g/t Au over 147.0 m in the ‘300 Horizon’. GS19-53 was stopped in gold mineralization due to inclement end-of-season weather.

Table l provides gold composites from five drill holes recently completed on two sections that cut the Goldstorm Zone and Table ll provides the drill collar data, including drill hole location, elevation, inclination, azimuth and hole length. Results for other holes on the sections have been reported previously.

Table l: Gold Composites GS19-49 to GS19-53

SectionDrill Hole From (m)To (m)Intercept (m)Gold Grade (gpt)
110+00NEGS19-50148.0725.5577.50.602
including160.0427.0267.00.811
GS19-51119.0365.0246.00.721
and578.0618.540.51.017
GS19-53**108.0255.0147.00.984
111+00NEGS19-4981.0907.5826.5 0.696
including81.0330.0249.00.998
and487.5606.0118.50.941
and750.0790.540.51.949
GS19-5262.0398.0336.01.004
including225.5312.587.02.006
GS19-53**drill hole stopped in mineralization, to be completed in 2020

* All assay values are uncut and intervals reflect drilled intercept lengths.

* True widths of the mineralization have not been determined

*HQ and NQ2 diameter core samples were sawn in half and typically sampled at standard 1.5m intervals.

Table ll: Drill Hole Data

SectionDrill HoleN_ N83_Z9E_N83_Z9ELEV_mAzimuthInclinationDEPTH(m)
110+00EGS19-506272886.7428393.71348.0111-70736.0
GS19-516272886.6428394.11347.3111-60635.0
GS19-536272885.8428394.11347.2113-50258.0
111+00EGS19-496272976.1428422.21370.5115-80960.1
GS19-526272974.9428423.91370.0115-50699.7

The updated Goldstorm Zone Sections 110+00 NE and 111+00 NE as well as the DDH Plan map are included at the bottom of the news release and on the Company’s website.

Walter Storm, Tudor Gold President and CEO, stated: “I am very pleased that the safe and successful 2019 exploration program has concluded on such a positive note. All 14 exploration drill holes hit their targets and they all returned very good results. The consistency of the mineralized intercepts from hole to hole is equally impressive. This years’ drill program has vastly increased the known size of the Goldstorm mineralized body but further drilling is essential to define the full length, width and depth of the system which still remains open in all directions.”

Cannot view this image? Visit: https://orders.newsfilecorp.com/files/682/49176_99c64899f4a48b79_001.jpg

Map of the Sulphurets Hydrothermal System showing the “string of pearls” described by Konkin.

To view an enhanced version of this graphic, please visit:
https://orders.newsfilecorp.com/files/682/49176_99c64899f4a48b79_001full.jpg

QA/QC

Drill core samples were prepared at MSA Labs’ Preparation Laboratory in Terrace, BC and assayed at MSA Labs’ Geochemical Laboratory in Langley, BC. Analytical accuracy and precision are monitored by the submission of blanks, certified standards and duplicate samples inserted at regular intervals into the sample stream by Tudor Gold personnel. MSA Laboratories quality system complies with the requirements for the International Standards ISO 17025 and ISO 9001. MSA Labs is independent of the Company.

Qualified Person

The Qualified Person for this news release for the purposes of National Instrument 43-101 is Tudor Gold’s Exploration Manager, Ken Konkin, P.Geo. He has read and approved the scientific and technical information that forms the basis for the disclosure contained in this news release.

This press release is available on the American Creek CEO Verified Discussion Forum, a moderated social media platform that enables civilized discussion and Q&A between Management and Shareholders.

About American Creek

American Creek is a Canadian junior mineral exploration company with a strong portfolio of gold and silver properties in British Columbia.

Three of those properties are located in the prolific “Golden Triangle”; the Treaty Creek and Electrum joint venture projects with Tudor Gold/Walter Storm as well as the 100% owned past producing Dunwell Mine.

The Treaty Creek Project is a Joint Venture with Tudor Gold owning 60% and acting as operator. American Creek and Teuton Resources each have 20% interests in the project. American Creek and Teuton are both fully carried until such time as a Production Notice is issued, at which time they are required to contribute their respective 20% share of development costs. Until such time, Tudor is required to fund all exploration and development costs while both American Creek and Teuton have “free rides”.

More information about the Treaty Creek Project can be found here: https://americancreek.com/index.php/projects/treaty-creek/home

A drill program is also ongoing on American Creek’s 100% owned Dunwell Mine property located near Stewart. More information can be found here: https://americancreek.com/index.php/projects/dunwell-mine

The Corporation also holds the Gold Hill, Austruck-Bonanza, Ample Goldmax, Silver Side, and Glitter King properties located in other prospective areas of the province.

For further information please contact Kelvin Burton at: Phone: 403 752-4040 or Email: [email protected]. Information relating to the Corporation is available on its website at www.americancreek.com.


Figure 1

Cannot view this image? Visit: https://orders.newsfilecorp.com/files/682/49176_99c64899f4a48b79_002.jpg


To view an enhanced version of Figure 1, please visit:
https://orders.newsfilecorp.com/files/682/49176_99c64899f4a48b79_002full.jpg


Figure 2

Cannot view this image? Visit: https://orders.newsfilecorp.com/files/682/49176_99c64899f4a48b79_003.jpg


To view an enhanced version of Figure 2, please visit:
https://orders.newsfilecorp.com/files/682/49176_99c64899f4a48b79_003full.jpg


Figure 3

Cannot view this image? Visit: https://orders.newsfilecorp.com/files/682/49176_99c64899f4a48b79_004full.jpg


To view an enhanced version of Figure 3, please visit:
https://orders.newsfilecorp.com/files/682/49176_99c64899f4a48b79_004full.jpg


Figure 4

Cannot view this image? Visit: https://orders.newsfilecorp.com/files/682/49176_99c64899f4a48b79_005full.jpg


To view an enhanced version of Figure 4, please visit:
https://orders.newsfilecorp.com/files/682/49176_99c64899f4a48b79_005full.jpg

betterU Implements Newly Developed Global SAAS Corporate Skilling Program

Posted by AGORACOM at 8:14 AM on Monday, October 28th, 2019
  • Announced the implementation of their newly developed software as a service (SAAS) corporate skilling program (Skill, Reskill Upskill)
  • Provides employers with a simple solution that supports more effective skilling solutions and addresses most of the complexities faced by corporations globally.

OTTAWA, Oct. 28, 2019 (GLOBE NEWSWIRE) — betterU Education Corp. (TSX VENTURE: BTRU, Frankfurt: 5OGA) (the “Company” or “betterU”) is pleased to announce the implementation of their newly developed software as a service (SAAS) corporate skilling program (Skill, Reskill Upskill) focused on providing employers with a simple solution that supports more effective skilling solutions and addresses most of the complexities faced by corporations globally.

betterU is currently working with three large corporate clients in India that have expressed interest to test the new SAAS skill program. This is currently being assembled and is expected to start within the next week.

betterU has spent the last six months working with their corporate partners in India to understand how to best support their areas of most need for skilling their employees.  It was determined that corporations not only in India, but around the world seem all face similar skilling challenges in that there is no single solution that can support all aspects of corporate training.

Learning and development (L&D) leaders are required to support training across dozens of departments, covering hundreds of job roles and thousands of possible skills needed to support their global employees. In today’s current training environment, what this means is that a L&D leader must engage with multiple assessment providers, educators, and ed-tech companies separately. This creates a lot of challenges and forces an often small L&D team to take on the integration of multiple vendors into their own management systems (if they have one) and then determine how to best aggregate multiple reports from these different vendors onto a single dashboard to get a clear picture of their employees’ development.

Many corporations have expressed their frustrations with having to manage all these variables in trying to create proper skilling paths for each employee across multiple adhoc solutions. This still doesn’t take into consideration having to also deal with multiple payment structures and subscriptions models for upwards of 1,000s of courses per person, regardless of how many courses the individual employee may actually need.

L&D teams are spending more time focused on integration challenges versus their learning and development goals, while overpaying for services and solutions that might not be right for them or their employees. The corporate skilling landscape is fragmented simply because there is no one simple solution, until now.     

betterU realized the solution for corporations would require a pivot from how they were approaching their corporate offerings. A new solution was required to shift from selling courses or course providers to selling the end results for a skilled resource. The Company realized that they must look at the person who needs the training to understand their specific goals, verses throwing a pool of courses at an organization, hoping it helps upskill the individual while leaving the management of results to the L&D leader to figure out. Through a payment structure of under US$100/month per employee, betterU will focus on corporate business intelligence, understanding corporates objectives and aligning those objectives with managed and measured employee goals. By moving towards a data driven model, betterU will be able to individualize learning for each employee. The new betterU SMART model is quite simple when you have all the ingredients. Over the last 6 years, betterU has been bringing together key partnerships and technological advancements that create an all-encompassing solution. This pivot while still leveraging all the assets betterU has been developing, will follow betterU’s newly developed SMART process.

  • Strategy â€“ Determine your corporate goals
  • Measure â€“ Define what skills are needed to achieve those goals.
  • Assess â€“ Assess your employees on the skills required.
  • Results â€“ Analyse your assessment results to determine the skills path.
  • Train â€“ Provide skills training

To develop the right skills within an organization, an employer must first determine what skills they need to achieve their business goals and then map them against the skills their employees have. Skills Needed – Skills Possessed = Skills Gap. To guarantee success when closing your organization’s skills gap, you must follow a SMART process.

“When building any business, entrepreneurs often find themselves entering into new territories that have yet to be developed or solved; so, we are also learning as we go as well.  We make mistakes, learn from them and then we need to be able to quickly adapt.  This has been the case in any business I have personally built. I am excited about this pivot as I see how it will address what the corporate world has been struggling withIt has not only opened up more opportunities for India, but also around the world, for instance in Canada, USA, Africa, as this solution is more easily scalable as it is not restricted by territories.” said Brad Loiselle, CEO of CEO betterU.

Before investing considerable time into development, betterU connected with many corporate L&D leaders in both India and Canada to assess this new approach and to determine a level of interest. With several hundred replies expressing interest to learn more, betterU started to build the technology, processes and materials.

To support the Skill, Reskill, Upskill solution, betterU’s team is now developing their Enterprise Management System to support the integration of all assessment partners and aggregate all requirements for individualizing learning paths.  This beta version will be completed in the next 2-3 weeks and will provide corporations with one solution that can address all their learning requirements.                      

More about the Skill, Reskill, Upskill Program

A one-size-fits all approach is no longer an option!

betterU’s Skill, Reskill, Upskill program provides access to multiple global providers’ 10,000+ courses, 1,000+ assessments and support tools for each employee’s growth within one easy to use ecosystem to manage. betterU will manage the entire back end and simply provide employers access to employee assessments results and a development plan. Each month they will receive an updated report showing their advancements and adjustments to their plans.

How does it work? By following betterU’s SMART process, they work to incorporate the learning requirements of the Corporate, and we will guide their learners through an automated assessment process based their employer’s needs. From there, betterU’s system will assign an individualized learning path based on the employee’s assessment result, pulling from betterU’s global education library, which might require content for multiple providers. Employers receive only one aggregated report no matter how many assessment and education providers participant in their employees learning plan. The program repeats monthly, adjusting the employee’s development plan based on their results and their defined growth plan. No more overpaying for generic programs that only apply to some of your workforce. No more paying for adhoc services to fill short-term missing gaps.

About betterU Education Corp.

betterU, a global education to employment platform, aims to provide access to quality education from around the world to foster growth and opportunity to those who want to better their lives. The company plans to bridge the prevailing gap in the education and job industry and enhance the lives of its prospective learners by developing an integrated education to employment ecosystem.

betterU has also planned and developed offerings that can be categorized into several broad functions: to compliment school programs with flexible preschool, KG-12 programs preparing children for next stage of education, to provide access to global and localized educational programs from leading educators, to foster an exceptional educational environment by providing befitting skills that lead to a better career, to bridge the gap between one’s existing education and prospective job requirement by training them and lastly, to connect the end user to various job opportunities.

betterU today has partnered with over 75 global educators, representing access to 10s of thousands of programs. It is developing technology and onboarding more partners required to support the growing education needs of the world.  

For more information, please visit www.betterU.in

Contact:

Brad Loiselle, CEO

better Education Corp.
Investor Relations 
1-613-695-4100 
Email: [email protected]

Gratomic Inc $GRAT.ca Processing and Stockpiling Aukam Mine Graphite in Preparation for Sales $SRG.ca $NGC.ca $LLG.ca $GPH.ca $NOU.ca

Posted by AGORACOM at 1:24 PM on Thursday, October 24th, 2019
  • 178 tonnes of product processed through the existing pilot plant
  • Systematically increased the grade to commercially desirable 95% – 97% Cg (Carbon in Graphite)
  • Able to upgrade this material to over 99% Cg through air classification
  • 350 tonnes of graphitic material stockpiled at the processing site ready for beneficiation

TORONTO, Oct. 24, 2019 /CNW/ – Gratomic Inc. (“Gratomic” or the “Company”) (TSX-V: GRAT) (CB81–FRANKFURT; WKN:A143MR) a vertically integrated graphite to graphenes, advanced materials development company is pleased to provide further updates from its Aukam Graphite Project in Namibia.

The Company is pleased to report that is has completed the crushing and grinding circuit which has a 50 metric tonnes per hour capacity. The Company also completed the installation and setup of the Processing Plant’s Rougher, Cleaner and Scavenger flotation columns.  The cumulative capacity of the columns combined with the Rougher Mixing Tank and slurry line is initially 2.8 tonnes per hour.

To date the Company has put 178 tonnes of product through the existing pilot plant systematically increasing the grade to commercially desirable 95% – 97% Cg (Carbon in Graphite). It has further indicated that it is able to upgrade this material through air classification to over 99% Cg.

Operationally, the Company has decided to put on hold an updated drying circuit pending financing of the Company. The drying circuit will be shipped to Namibia after the final payment of CAD $75,000 is made and will arrive within 39 days of the payment. The Company has decided to delay this upgrade in the short term in order to preserve available capital and will utilize the existing drying circuit which can manage the material drying requirements in the interim.

The Company has entered into an agreement with VIVO Shell in July of 2019 (the “Agreement”) to invest N$ 700,000 into the construction of a bulk 50,000 litre fuel storage facility that will be erected at the Aukam Fuel depot located within 1.2 km from the mine site. The Company is also in discussions with Namibia’s largest mining contractor “LEWCOR” and is reviewing plans to initiate mining and earth moving operations.

In preparation of product sales, a total of 350 tonnes of graphitic material has been stockpiled at the processing site ready for beneficiation. During the first two months of the LEWCOR contract, the stockpile will be further increased to 5,000 tonnes from available surface mine dumps which contain approximately 23,000 tonnes of graphitic material.

Management will be curtailing ongoing mining costs by temporarily reducing non-critical staff until the completion of a financing. The Company sees this as a positive means to decrease monthly capital requirements by approximately 75%.  All staff has been paid up to date with salaries being supported primarily through capital injection by the company’s two CEOs.  The non-critical mine staff that are not directly affiliated with mine construction will be rehired upon the completion of a financing to resume mining and processing activities.

Risk Factors

The Company advises that it has not based its production decision on even the existence of mineral resources let alone on a feasibility study of mineral reserves, demonstrating economic and technical viability, and, as a result, there may be an increased uncertainty of achieving any particular level of recovery of minerals or the cost of such recovery, including increased risks associated with developing a commercially mineable deposit.

Historically, such projects have a much higher risk of economic and technical failure. There is no guarantee that production will begin as anticipated or at all or that anticipated production costs will be achieved.

Failure to commence production would have a material adverse impact on the Company’s ability to generate revenue and cash flow to fund operations. Failure to achieve the anticipated production costs would have a material adverse impact on the Company’s cash flow and future profitability.

Qualified Persons

Steve Gray, P. Geo. has reviewed, prepared and approved the scientific and technical information in this press release and is Gratomic Inc’s “Qualified Person” as defined by National Instrument 43-101 – Standards of Disclosure for Mineral Projects.

About Gratomic Inc.

Gratomic is an advanced materials company focused on mine to market commercialization of graphite products most notably high value graphene-based components for a range of mass market products. The Company has a JV collaborating with Perpetuus Carbon Technology, a leading European manufacturer of graphenes, to use Aukam graphite to manufacture graphene products for commercialization on an industrial scale. The Company is listed on the TSX Venture Exchange under the symbol GRAT.

Applied BiSciences $APPB Signs Agreement to Sell Pond Naturals’ Supplements Including its X10 Pet Supplements in the U.S. $CGRW $APH.ca $GBLX $PFE $ACG.ca $ACB.ca $WEED.ca $HIP.ca $WMD.ca

Posted by AGORACOM at 9:13 AM on Thursday, October 24th, 2019
  • Pond Naturals, has entered a three-year license agreement with Applied Products to expand the distribution of its astaxanthin-based pet supplement to the U.S
  • Applied BioSciences is focused on the development of science-driven biopharmaceuticals and the production of high-quality health and wellness products that target the endocannabinoid system.
  • X10 has seen great traction in Canada as one of the only pet health products in the anti-aging category. Applied Products will make for a great partner as we enter the US market through the existing Herbal Pet e-commerce channels.”

BEVERLY HILLS, CA / ACCESSWIRE / October 24, 2019 / Applied Products (“Applied” or the “Company”), a division of Applied BioSciences Corp.(OTCQB:APPB) and Pond Technologies Holdings Inc.(“Pond”) (TSX.V:POND), announced today that Pond Naturals, Pond’s wholly owned subsidiary, has entered a three-year license agreement with Applied Products to expand the distribution of its astaxanthin-based pet supplement to the U.S. As part of the agreement, Pond will sell its X10-branded pet products through Applied Products’ established online sales channels.

Applied BioSciences is focused on the development of science-driven biopharmaceuticals and the production of high-quality health and wellness products that target the endocannabinoid system. Through its Applied Products division, the Company currently develops multiple brands offering high quality health and wellness CBD products that conform to the highest regulatory standards and markets through established channels in the US, including its premium pet brand, Herbal Pet.

Grant Smith, Pond Naturals’ President, commented, “Since its launch in April 2019, X10 has seen great traction in Canada as one of the only pet health products in the anti-aging category. Applied Products shares our values and will make for a great partner as we enter the US market through the existing Herbal Pet e-commerce channels.”

Herbal Pet consists of a line of pet supplements that uses hemp-derived CBD to address conditions such as pain, inflammation, anxiety, or digestion. Applied Products intends to sell the Pond Naturals X10 product line alongside Herbal Pet products through its existing e-commerce channels. The Pond X10 product line contains a powerful antioxidant, astaxanthin, extracted from algae at Pond Natural’s Agassiz, British Columbia facility. Astaxanthin is a naturally occurring fat-soluble super carotenoid found in certain microalgae with a unique range of health benefits.

“We are excited to introduce X10 to our loyal customer base as a synergistic product to our Herbal Pet CBD product line,” Chris Bridges, Board Member of Applied Products, stated. “Adding X10 to our product portfolio allows us to specifically target senior pets whose owners may witness a noticeable improvement in mobility, energy, and attitude in their beloved companion animals.”

The X10 product is designed to benefit ten aspects of a pet’s health by reducing free radical damage which may promote recovery and slow down the natural effects of aging on the body. Visit www.X10Pet.comfor more information on the pet product.

About Pond Technologies

Located in Markham, Ontario, Pond is a technology company that provides profitable solutions to the global health and wellness challenges of climate change and nutrition. Pond’s proprietary growth platform, including patented advanced photonics, optimizes key growth inputs in order to provide a controlled environment that maximizes the growth of algae and other organisms.

About Applied BioSciences Corp.

Applied BioSciences is a vertically integrated company focused on the development and commercialization of novel, science-driven, synthetic cannabinoid therapeutics/ biopharmaceuticals that target the endocannabinoid system to treat a wide-range of diseases across multiple therapeutic areas. We also deliver high-quality consumer and OTC THC-free CBD products that promote overall health and wellbeing as well as state-of-the-art testing and analytics capabilities to our customers. For more information, visit the Company’s website.

American Creek $AMK.ca Reports New Findings Regarding Gold Hill Project and Previously Reported Assay Results for First Four Phase One Drill Holes $TUD.ca $SII.ca $GTT.ca $AFF.ca $SEA.ca $SA $PVG.ca

Posted by AGORACOM at 11:43 AM on Wednesday, October 23rd, 2019
  • 100% owned Gold Hill property located in the Boulder Creek drainage, a tributary of the Wildhorse River located east of Fort Steele, British Columbia.
  • Re-logging of the drill core has confirmed that much of the gold within several drill core intersections was in fact not reflected in the initial assay results.
  • Hole NS18-01 contained 66.4 g/t gold over 0.2 meters (true width unknown)

Cardston, Alberta–(Newsfile Corp. – October 23, 2019) –  American Creek Resources Ltd. (TSXV: AMK) (“American Creek”) reports that further work is being conducted related to the drill core from the phase one drill program conducted in 2018 on its 100% owned Gold Hill property located in the Boulder Creek drainage, a tributary of the Wildhorse River located east of Fort Steele, British Columbia.

The preliminary program included four diamond drill holes on two sections totaling 2,087 meters of drilling. Nine hundred and twenty-nine (929) drill core samples were analyzed and assay results were reported on March 15, 2019. While management was pleased and very encouraged by the results as there were multiple gold intersections in all 4 preliminary drill holes, it was suspected that the initial assay results did not accurately reflect the amount of gold within the core and may have in fact missed much of the gold due to “nugget effect” and the coarse nature of the gold.

Re-logging of the drill core has now been concluded and this effort, along with further recent prospecting on the property, has confirmed that much of the gold within several drill core intersections was in fact not reflected in the initial assay results. During re-logging of the core visible gold was discovered in quartz veins in at least four new locations where assays indicated only trace or very low grade gold values.

As a first step, several samples have been selected for re-assay which will include screening for metallics in an effort to mitigate against and eliminate the “nugget effect” and get a more accurate assay as to actual gold present. Additional assay results, findings and conclusions will be reported in due course.

2018 Drill Program

The 2018 drill program was conducted to test a Cretaceous age swarm of syenite porphyry dykes intruded into lower and middle Cambrian sediments. Four holes on two sections were drilled (see map below) This is the first time that this package of rocks has ever been drilled.

A high-grade intersection in hole NS18-01 contained 66.4 g/t gold over 0.2 meters (true width unknown). This intersection correlates with prior historic gold values obtained in the area. Car samples and face samples from a drift (small tunnel) driven partially along the hanging wall of a syenite porphyry dyke in 1937 were assayed over a width of 1.5 feet (~0.5m). The car samples averaged 0.43 oz. Au per ton (13.4 g/t), 0.48 oz. (14.9g/t) Ag per ton and 2.3% Pb per ton over 40 feet (12.2m). The face samples along 22 feet (6.7m) averaged at 2.4 oz. Au per ton (74.6 g/t) 2.17 oz. (67.5 g/t) Ag per ton and 5.51% Pb.

About the Gold Hill Project

The Gold Hill property covers approximately 836 hectares and is located along the eastern edge of the Kimberly Gold Trend. The property is road accessible by paved highway to Fort Steele and then by main logging roads to (and through) the property. Driving time from Cranbrook to the center of the property is less than one hour.

The property contains a significant portion of the Boulder Creek drainage, a tributary of the Wild Horse River which is considered to be one of the greatest placer gold rivers in the entire province. Gold rushes have taken place there since the 1860’s that have yielded over 48 tonnes of reported gold, making it Canada’s 4th largest placer producer. The majority of the gold recovered from the Wild Horse was located along a 6 km stretch between Boulder Creek (upstream) and Brewery Creek (downstream). From the point where Boulder Creek enters the Wild Horse River for a distance of 6 kilometers downstream, a minimum of 1.5 million ounces (45,655,215 grams) of placer gold was recovered between 1864 and the 1930’s. In addition, an undetermined amount of placer gold was sold in the United States during this period but no records of the amount are available. The Boulder Creek drainage is the logical source of the placer gold recovered from the Wildhorse River below.

Early efforts by prospectors to locate the source of the Wild Horse placer gold led explorers up Boulder Creek to what is now called the Gold Hill property. Although lode gold was first found in the area by prospectors in the late 1800’s, the Gold Hill property has not been the subject of any systematic modern exploration and prior to this program, the property has never been drill tested.

There are two main highly prospective targets on the property:

1. The Midas / Gold Hill prospect which is situated on the southern part of the property. The Midas is in an area of steep topography and is structurally controlled.

2. The Big Chief prospect which is situated on the northern portion of the property. The Big Chief is located on an area of moderate relief and is formed by hydrothermal activity from intruded syenite dikes of Cretaceous age.

The property is nominally divided into north and south portions by Boulder Creek which flows westerly through the property. Phase 1 of the exploration program focused solely on a portion of the Big Chief prospect. The highly prospective area of the property situated south of Boulder Creek was not explored during 2018. This southern area, which includes high grade gold values in grab samples including 25.14 g/t from the Guggenheim showing, will be included in future phases of exploration.

Total Metal Discussion

Gold values, as tested by initial ICP analysis, ranged from slightly less than 0.5 g/t to 5.68 g/t. With reference to sample 043174 in hole NS18-01, where the initial analysis placed gold at >30,000 ppb (30.0 g/t), total metal analysis of the same sample returned a value of 66.4 g/t. To date, this is the only sample that has been analyzed for total metal. It was originally selected because of the proximal galena and visible gold.

Historical work on the property has noted the presence of metallic gold in samples that is not detected by conventional ICP analysis. A skilled, well trained and experienced Prospector discusses this phenom in Assessment Report 27,173 (Dec. 29, 2004). Again, in AR 34,920, (July 2015) a P. Geo. explained the presence of metallic gold. The following is a direct quote from AR 34,920 by the highly experienced P. Geo. who mapped the property: “work by the original prospectors and miners on the property from 1898 to 1957 did a good job of exposing gold-bearing structures and the related sulphides and gangue minerals. This work demonstrated the course nature of the gold which is commonly visible to the naked eye.”

Darren Blaney, CEO of American Creek stated: “This recent work has confirmed our suspicions that much of the high grade gold in the drill core was missed by the initial assays. While it will be challenging to determine the exact amount of gold we have in the core, we welcome the problem as it means we have successfully discovered multiple intersections of high grade visible, coarse gold in quartz veins in our preliminary phase one program. A further significant step in unravelling the mystery of the potential source of the large quantity of Wild Horse river placer gold collected downstream.”

Cannot view this image? Visit: https://orders.newsfilecorp.com/files/682/49040_fbdb3d4cd427f896_001.jpg


Figure 1: Image of visible gold found in core at Gold Hill

To view an enhanced version of Figure 1, please visit:
https://orders.newsfilecorp.com/files/682/49040_fbdb3d4cd427f896_001full.jpg

More pictures of the drill program can be viewed here in the Gold Hill Project photo gallery:https://americancreek.com/index.php/media-page/gallery/category/14-office

Cannot view this image? Visit: https://orders.newsfilecorp.com/files/682/49040_fbdb3d4cd427f896_002.jpg

Figure 2: Drill Hole Locations

To view an enhanced version of Figure 2, please visit:
https://orders.newsfilecorp.com/files/682/49040_fbdb3d4cd427f896_002full.jpg

Qualified Person

Frank O’Grady, P.Eng., is the Qualified Person as defined by National Instrument 43-101 for the Gold Hill Project and for this news release.

Important Links

A summary of the Gold Hill project can be found here:
https://americancreek.com/images/Gold_Hill_Summary_2018.pdf

About American Creek

American Creek holds a strong portfolio of gold and silver properties in British Columbia.

Three of those properties are located in the prolific “Golden Triangle”; the Treaty Creek and Electrum joint venture projects with Tudor Gold (Walter Storm) as well as the 100% owned past producing Dunwell Mine.

The Corporation also holds the Austruck-Bonanza, Ample Goldmax, Silver Side, and Glitter King properties located in other prospective areas of the province.

For further information please contact Kelvin Burton at: Phone: 403 752-4040 or Email: [email protected]. Information relating to the Corporation is available on its website at www.americancreek.com

INTERVIEW: “The Gold Standard Of Gold Research” Publisher, Ronnie Stoeferle, Appointed To Affinity Metals $AFF.ca $SII.ca $TUD.ca $GTT.ca $AMK.ca $OSK.ca

Posted by AGORACOM-JC at 9:36 AM on Wednesday, October 23rd, 2019

When the Wall Street Journal calls your Gold Report “The Gold Standard Of Gold Research”, it is safe to say you are a global influencer and expert in all things gold.

This is Ronnie Stoeferle, whose “In Gold We Trust” report has also been downloaded 1.8 million times in English, German and Mandarin in case anyone had any doubt as to his expertise.

Today, Ronnie became the founding member of the Affinity Metals (AFF:TSXV) Advisory Board, which implies that we can expect others to be appointed as well. Why would Ronnie join a company with a market cap under $5,000,000?  You’ll have to watch the interview to find out … but here are a couple of hints:

1.  Affinity Metals flagship project, the Regal, has reported HISTORICAL reserves of 590,703 tonnes grading 71.6 grams per tonne silver, 2.66 per cent lead, 1.26 per cent zinc, 1.1 per cent copper, 0.13 per cent tin and 0.015 per cent tungsten.  These were prepated prior to 43-101 standards and should not be relied upon until they are brought into compliance with 43-101 standards. 

2.  A Technical Report, which was prepared in 1971 using a silver price of $1.75 per troy ounce, makes a positive recommendation for production, including the establishment of a 500 ton per day concentrator with a 400 ton per day silver, lead and zinc circuit and a 100 ton per day tin, tungsten and copper circuit.

These are just 2 factors that led Ronnie to declare that Affnity Metals is “one of the largest investments in my private portfolio”.

Grab your favourite beverage, kick back and watch this great interview with both Ronnie and Affinity CEO, Rob Edwards.

Advance Gold $AAX.ca – Gold Prepares For Next Phase Of Bull Market $SIL.ca $FA.ca $ANG.jo $ABX.ca $NGT.ca $MGG.ca $TECK.ca

Posted by AGORACOM at 4:48 PM on Tuesday, October 22nd, 2019

SPONSOR: Advance Gold AAX.v – Advance Gold controls 100% interest in the Tabasquena Silver Mine in Zacatecas, Mexico. A cluster of 30 Epithermal veins have been discovered, with recent emphasis on exploring a large anomaly to drill. Advance also owns 15% of the Kakamega JV attached to Barrick Takeover Offer for Acacia Mining. Click Here For More Info

This image has an empty alt attribute; its file name is AAX-square-Logo.png
  • Fears of a Trans-Atlantic trade war have increased gold’s safety bid.
  • U.S. economic data also continues to attract safety seekers to gold.
  • All signs point to a continuation of the metal’s bull market in Q4.

After a brief respite last month, fear and uncertainty have returned with a vengeance in October. Recent world events have given investors plenty of reasons to fear an expansion of the global trade war.

Meanwhile on the domestic front, investors are becoming increasingly alarmed by soft economic data which some interpret as a harbinger of recession. Gold’s “fear factor” has thus been resuscitated, bringing with it the promise of stronger prices in the months ahead. Here we’ll discuss the growing number of variables which suggest gold is consolidating its recent gains ahead of the next stage of its long-term bull market.

One sign of a market controlled by the bulls is the steadfast refusal of prices, following a correction, to stay down for long. Bull markets have a tendency to consolidate gains achieved during extended rallies in the form of a lateral trading range, or sideways drift. That appears to be the form of gold’s most recent correction in September following a productive three-month rally.

Although gold prices briefly violated a key short-term trend line earlier this week, the bulls fought back fiercely and pushed prices back above the widely, followed 50-day moving average within two days of the violation. It may take several more days for gold to regain enough strength and build the support necessary to stay above the 50-day MA. But the signs are plainly evident that the bulls are clawing their way back to controlling gold’s immediate-term (1-4 week) trend.

Source: BigCharts

And while gold prices haven’t kept pace with its nearest competitor in the rush to safety – namely U.S. Treasury bonds – it’s instructive that gold has so far responded favorably to most of the latest negative economic and political news. For instance, gold jumped nearly 1.5% on Oct. 2 after the release of the latest ADP National Employment Report. The report showed that private payroll growth by U.S. employers slowed in September and wasn’t as strong in August as previously estimated, according to a Reuters article. Reuters reporter Lucia Mutikani, capturing the sentiment which has overtaken many gold investors, observed:

The longest economic expansion on record, now in its 11th year, is losing ground with the blame largely put on a 15-month trade war between the United States and China, which has eroded business confidence.”

It’s further believed by many investors that the growing signs of a slowing U.S. economy could influence the Federal Reserve to further lower its benchmark interest rate this fall. Lower rates are widely regarded as bullish for gold since it reduces the competition vs. interest-bearing assets for the non-yielding metal.

Elsewhere on the U.S. economic front, the recent disappointments in the Purchasing Managers’ Index (PMI) is another reason for the revival of gold’s fear factor. The PMI has now fallen for seven consecutive months and is below 50.0, which indicates contraction in the manufacturing sector.

The latest disappointing PMI readings also have weighed heavily on the U.S. dollar index (DXY) of late. The dollar fell to one-week lows against the euro and yen on Oct. 3. However, the dollar index is still close to a multi-year high, which means that gold doesn’t yet enjoy support from its currency component (see chart below). Nonetheless, gold has proven to be stalwart enough this year under the influence of the fear factor alone and in spite of a strong dollar. Thus, a weaker dollar isn’t necessarily a prerequisite for a Q4 gold rally.

Source: BigCharts

Aside from a weakening manufacturing sector, the U.S. service sector also is showing signs of slowing. The latest ISM survey released on Oct. 3 showed service-sector activity for September fell to its lowest level in three years. Some analysts blamed the U.S.-China trade dispute for the slowdown. The latest ISM Non-Manufacturing Index fell to 52.6 last month as new orders fell more than expected. This disappointed economists’ expectations of 55.3. This increased gold’s allure as a safe haven in the eyes of many investors and should provide some underlying support for the metal going forward.

In yet another development which bolsters gold’s safety bid, the U.S. won approval on Oct. 2 from the World Trade Organization to levy tariffs on $7.5 billion worth of European goods. The WTO’s decision relates to illegal subsided given to Airbus (EASDF) and Boeing (NYSE:BA). Consequently, many investors fear the outbreak of yet another front in the ongoing global trade war.

In view of the above-mentioned factors, gold’s intermediate-term (3-6 month) upward trend looks secure. The only thing standing in the way of a renewed immediate-term gold buy signal, however, is confirming strength in gold’s sister metal. Silver remains below its 15-day moving average, as can be seen in the iShares Silver Trust (ETF) below. As I mentioned in a previous report, we need to see silver confirm gold’s returning strength before we get a confirmed re-entry signal. A lack of confirmation from silver normally means that gold’s rally will fail due to the lack of institutional demand. Historically, when market-moving institutional investors are bullish enough to buy gold, they usually buy silver as an adjunct.

Source: BigCharts

Another sign that should accompany gold’s next confirmed breakout is a return to strength in the actively traded U.S. mining shares. Shown below is the PHLX Gold/Silver Index (XAU), which remains below its 15-day moving average as of Oct. 3. To get a renewed buy signal for gold stocks in the aggregate, we should see a two-day higher close above the 15-day in the XAU. Moreover, a gold stock rally tends to accompany a rally in bullion prices due to the leverage factor of the miners, which attracts precious metals investors.

Source: BigCharts

In summary, a growing number of worries on the U.S. economic and global trade fronts has provided gold with a renewed safety bid. The evidence reviewed here suggests that gold prices are consolidating ahead of another breakout attempt this fall. Confirming strength in the silver price would increase gold’s bullish prospects in Q4, as would a breakout in the leading gold mining stocks. With trade war threats on the rise, however, gold is poised to benefit from safe-haven demand and keep its bull market intact. Investors are therefore justified in maintaining longer-term investment positions in the yellow metal.

On a strategic note, I’m waiting for both the gold price and the gold mining stocks to confirm a breakout before initiating a new trading position in the VanEck Vectors Gold Miners ETF (GDX), my preferred trading vehicle for the mining stocks. I’m currently in a cash position in my short-term trading portfolio

SOURCE: https://seekingalpha.com/article/4295225-gold-prepares-next-phase-bull-market