Agoracom Blog

The DRC Should Become the Largest Mining Economy in Africa SPONSOR: Loncor Resources $LN.ca $ABX.ca $TECK.ca $RSG $NGT.to $GOLD $NEM

Posted by AGORACOM at 10:07 AM on Wednesday, April 29th, 2020

Sponsor: Loncor, a Canadian gold explorer controlling over 3.6 million high grade ounces outside of a Barrick JV. The Ngayu JV property is 200km southwest of the Kibali gold mine, operated by Barrick, which produced 814,000 ounces of gold in 2019. Barrick manages and funds exploration at the Ngayu project until the completion of a pre-feasibility study on any gold discovery meeting their Tier One investment criteria. Newmont $NGT $NEM owns 7.8%, Resolute $RSG owns 27% Management owns 29% Click Here for More Info

This image has an empty alt attribute; its file name is Loncor-Small-Square.png
https://d3gvybjp3zjp3i.cloudfront.net/wp-content/uploads/2020/04/drc-money-new-640x480.jpg

“Investment appetite in the resources sector is low and investment hurdles have been raised which means that only the best investment jurisdictions, like the Democratic Republic of Congo, will receive much needed investment for growth.”

This is according to Dr Tony Harwood, president and CEO of Montero Mining and Exploration.

“The slow-down in the global economy has depressed metal prices and the advent of the Coronavirus (COVID-19) has also exacerbated this, bringing many countries into a negative growth and some in recession,” Dr Harwood, who is also an ambassador for DRC Mining Week, continues.

In addition, the implementation of the new DRC mining legislation has caused concerns with existing investors and potentially new foreign investors to the DRC.

Despite these challenges progress made on some very exciting mining and exploration projects, notably developments of the world class Kamoa-Kakula copper project and Kipushi zinc project, notes Harwood.

“Other highlights for the DRC include the development of the high grade Bisie Tin project as well as seeing gold production being achieved at Kibali gold mine,” Harwood points out.

Positive approach needed

In addressing the challenges surrounding the country’s divisive mining legislation Harwood encourages current investors to discuss changes in a positive manner with government for an equally equitable solution for both parties.

Harwood believes the development of the Kamoa-Kakula copper project will open the Katanga province and encourage further exploration and development not only in this area but the country as well.

“Its success will aid greatly in the development of the DRC mining sector not only from a production perspective but also by increasing employment, skills transfers, taxes paid, infrastructure development both in the DRC and in neighbouring countries,” states Harwood.

Looking to the future Harwood is adamant good mining legislation with investor incentives will boost local capital and entice foreign investors will ensure growth and if the DRC gets this right it will become the largest mining economy in Africa.

Harwood founded and listed the company on the TSX Venture exchange. He is also a non-executive director of private and public companies largely operating in Africa. In all he has listed three companies over the last 10 years all of which operate in Africa from a base in Africa.

Between 2006 and 2009 he was the President and CEO of Africo Resources, a company attempting to develop a high-grade coper project in Katanga.

During the exploration and development period the company entered various cooperative community development programmes with local villages surrounding the project.

These programmes largely revolved around agriculture and the company assisted in setting up community co-operatives for growing vegetables to be sold to the company and the surrounding communities. “In addition, we also set up health screening initiatives with the DRC health administration in and around our project area,” explains Harwood.

“In 2007 to 2008 we also distributed 328 wheelchairs for children. These had been designed for use in the country and had thick rubber tyres – this brought children a new mobility and enabled them to get to school and participate in their communities,” he concludes.

Source: https://www.miningreview.com/base-metals/the-drc-should-become-the-largest-mining-economy-in-africa/

Rolls-Royce To Work with Graphene Experts to Pioneer the Next Generation of Aero Engines SPONSOR: Gratomic $GRAT.ca $SRG.ca $NGC.ca $LLG.ca $GPH.ca $NOU.ca #TODAQ $NMI.ca

Posted by AGORACOM at 9:53 AM on Wednesday, April 29th, 2020
http://blog.agoracom.com/wp-content/uploads/2019/09/GRAT-square2.png

SPONSOR: Gratomic Inc. (TSX-V: GRAT) Advanced materials company focused on mine to market commercialization of graphite products, most notably high value graphene based components for a range of mass market products. Collaborating with Perpetuus, Gratomic will use Aukam graphite to manufacture graphene products for commercialization on an industrial scale. For More Info Click Here

Rolls-Royce has selected The University of Manchester’s Graphene Engineering Innovation Centre (GEIC) and award-winning Versarien subsidiary 2-DTech Ltd to help develop the use of graphene and other 2D materials within next-generation aero engines.

The initial programme will use the state-of-the-art chemical vapour deposition (CVD) equipment located within the GEIC.

The collaboration will look to explore, understand and create technological advances surrounding the use of graphene and other 2D materials used in wiring for next-generation aerospace engine systems.

The work will seek to use the unique properties of these 2D materials to reduce the weight of electrical components, improve electrical performance and also increase resistance to corrosion of components in future engine systems.

The programme aims to present potential economic benefits, through the possibility of significant cost reductions, and global environmental benefits, through the reduction of energy use and lower emissions from electrification.

Neill Ricketts, Chief Executive of Versarien, said: “The pursuit of sustainability has become an important goal for many companies in recent years. Rolls-Royce is one of the world’s leading industrial technology companies and today, the size and impact of the markets its serves makes this task more urgent than ever.

“Taking advantage of advanced materials such as graphene, has the potential to revolutionise these markets and add real benefit.

“The partnership with Rolls-Royce is a significant endorsement to 2-DTech’s work over the years and we are delighted it has been chosen by such a renowned business and look forward to working together.” “It’s great to see a company like Rolls-Royce partner with us and our other Tier 1 member, 2-DTech, to capitalise on our world-leading expertise and experience, along with specialist equipment, which will accelerate the product and process development and market entry. James Baker, CEO Graphene@Manchester”     Dr Al Lambourne, Materials Specialist at Rolls-Royce, said: “Partnering with the GEIC and its members makes perfect sense to Rolls-Royce as we explore the opportunities and properties of a new class of 2D materials.

“Using the unique capabilities of 2-DTech and the GEIC we hope to address some of the challenges facing materials in the global aerospace industry, as we pioneer the electrification of future aircraft.”

James Baker, CEO of Graphene@Manchester, said: “The GEIC is intended to act as an accelerator for graphene commercialisation, market penetration and in the creation of the material supply chain of graphene and 2D materials.

“It’s great to see a company like Rolls-Royce partner with us and our other Tier 1 member, 2-DTech, to capitalise on our world-leading expertise and experience, along with specialist equipment, which will accelerate the product and process development and market entry.”

Advanced materials is one of The University of Manchester’s research beacons – examples of pioneering discoveries, interdisciplinary collaboration and cross-sector partnerships that are tackling some of the biggest questions facing the planet. #ResearchBeacons

Source: https://www.manchester.ac.uk/discover/news/rolls-royce-to-work-with-graphene-experts-to-pioneer-the-next-generation-of-aero-engines/

AGORACOM Welcomes ImagineAR $IP.ca An Augmented Reality platform That Allows Businesses To Easily Launch AR Campaigns $SEV.ca $VST.ca $YDX.ca $NTAR.ca

Posted by AGORACOM-JC at 8:52 AM on Wednesday, April 29th, 2020
http://www.smallcapepicenter.com/imagine%20ar%20squre.jpg

BREAKING: ImagineAR Signs Five Year $300,000USD Licensing Agreement with SlapItOn to Provide Augmented Reality for Athletes and Celebrities to Engage Fans

  • Contract Revenue is $300,000USD Plus 5 Year Management Program Revenue Fees 
  • SlapItOn is owned by an elite group of professional athletes including Mike Vanderjagt,Troy Aikman, Mike Modano, Johnny Damon, Steve Smith and Cobi Jones.

Why ImagineAR?

(IP:CSE) (IPNFF:OTCQB)

  • ImagineAR Has Already Started Commercializing Its Augmented Reality Platform
  • Clients Include: 
    • NBA Sacramento Kings
    • Mall of America
    • AT&T Shape
    • Basketball Hall Of Fame
    • Milwaukee AutoShow
  • Microsoft Authorized Co-Sell Partner
  • Closed Major Financing In Q1 2020
  • Enables businesses of any size to create and implement their own AR campaigns with no programming or technology experience
  • ImagineAR is now well positioned to further commercialize and capitalize on massive demand for Augmented Reality

WHAT IS AUGMENTED REALITY?

AR is going to dominate our daily lives sooner than you think. Why else do you think Tim Cook is so bullish?  But it’s still a new concept that most people haven’t seen yet, so let’s use a basic example. 

An ImagineAR client (i.e. Sacramento Kings) tells its fans to simply point their mobile device at something (i.e. Sacramento Kings Logo) and watch their phone come to life (i.e. a player posing for a picture, a mascot dancing, collecting a reward – the possibilities are endless). 

The result is that mobile phones can now be used to engage fans way beyond simple social media by bringing their worlds to life.  In the Sacramento Kings example above, fans at home can do the exact same thing and have a player appear right in their living rooms!  

ImagineAR clients can use logos, signs, buildings, products, landmarks and more to instantly engage with videos, information, advertisements, coupons, 3D holograms and any interactive content.

The best part?  Customers don’t need a big, expensive tech team to deploy ImagineAR.  The Company’s “AR-as-a-Service” Platform enables businesses of any size to create and implement their own AR campaigns with no programming or technology experience.

WHAT IS THE DIFFERENCE BETWEEN AUGMENTED REALITY AND VIRTUAL REALITY?

We knew some of you may have been thinking this, so here’s a quick and easy answer.

AR uses your existing environment and overlays new information (as in the example above). 

VR creates a completely new virtual environment (i.e. a sci-fi fantasy world).

SEEING IS BELIEVING!

Now that you have a baseline understanding of the power of AR, the next thing to do is see it for yourself. Watch these videos of ImagineAR in action and with some really happy users.

Hub On AGORACOM / Corporate Profile

ImagineAR $IP.ca Signs Five Year $300,000USD Licensing Agreement with SlapItOn to Provide Augmented Reality for Athletes and Celebrities to Engage Fans $SEV.ca $VST.ca $YDX.ca

Posted by AGORACOM-JC at 7:29 AM on Wednesday, April 29th, 2020
http://www.smallcapepicenter.com/imagine%20ar%20squre.jpg
  • Contract Revenue is $300,000USD Plus 5 Year Management Program Revenue Fees 
  • SlapItOn is owned by an elite group of professional athletes including Mike Vanderjagt,Troy Aikman, Mike Modano, Johnny Damon, Steve Smith and Cobi Jones.

VANCOUVER and ERIE, PA, April 29, 2020  – Imagine AR Inc. (IP:CSE) (IPNFF:OTCQB) (“ImagineAR” or “Company”) is pleased to announce the signing of a five year $300,000USD licensing agreement to provide its Augmented Reality Platform to SlapItOn for the launch of their new line of interactive products featuring social media leaders, athletes and celebrities.  In addition to the five-year licensing fee, the agreement also provides for program management fees over the term which can significantly increase the annual revenue.

SlapItOn Ownership Includes Elite Athletes

SlapItOn is owned by an elite group of professional athletes including Founder, Chief Executive Officer and National Football League All-Pro Mike Vanderjagt and co-founders National Football League Hall of Famer and All-Pro Troy Aikman, National Hockey League Hall of Famer and All-Star Mike Modano, Major League Baseball All-Star and Two-Time World Champion Johnny Damon, National Basketball Association All-Star, NBA Champion and Olympic Gold Medalist Steve Smith and National Soccer Hall of Famer and Major League Soccer All-Star Cobi Jones.

The custom graphics company can take any image and convert it into an action decal in various sizes including walls, laptops, tablets and smartphones.  As a result of this Agreement with ImagineARTM, SlapItOn will now be expanding its offering to deliver interactive products integrated as an ‘all-in-one’ collectible sports card, decal and social media via augmented reality right into the homes of fans.

Mike Vanderjagt, Founder & CEO of SlapItOn stated “ImagineARTM is the most advanced augmented reality mobile platform in the marketplace today. By integrating ImagineARTM with hi-tech vinyl decals, we will be launching our new SlapItOn Interactive product line featuring social media leaders in sports & entertainment globally. We are planning to provide a unique platform in today’s world for artists and athletes to engage safely and consistently with fans in their homes.”

Alen Paul Silverrstieen, CEO of ImagineAR, stated “We are truly excited to develop a new product category with SlapItOn. Working with Mike and his sports legend partners, we are very optimistic that this partnership will grow significantly in the next few years.”

ImagineAR Launches AGORACOM Online Marketing And “CEO Verified” Discussion Forum as Primary Investor Social Media Discussion Platform

ImagineAR Inc. announced the launch of a “CEO Verified” Discussion Forum on AGORACOM. The forum will serve as the Company’s primary social media platform to interact with both shareholders and the broader investment community in a fully moderated environment.

The ImagineAR HUB is live and can be found at https://agoracom.com/ir/Imaginear

ImagineAR will also receive significant exposure through millions of content brand insertions on the AGORACOM network and extensive search engine marketing over the next 12 months. In addition, exclusive sponsorships of invaluable digital properties such as the AGORACOM home page and the AGORACOM Twitter account will serve to significantly raise brand awareness of the Company among small cap investors. AGORACOM is the only small cap marketing firm to hold a Twitter Verified badge, averaging 4.2 million Twitter impressions per month in 2019.

This News Release is available on the company’s CEO Verified Discussion Forum, a moderated social media platform that enables civilized discussion and Q&A between Management and Shareholders. 

ABOUT SlapItOn

SlapItOn is a custom graphics company that can take any image and turn it into an INTERACTIVE AR ACTION DECAL. The action decals are cut contoured and available in various sizes: wall, locker, tablet, and smartphone. A SlapItOn is made of a hi-tech vinyl that is reusable and is safe for any surface. To learn more, visit SlapItOn.Us

About ImagineAR

ImagineAR Inc. (CSE: IP) (OTC: IPNFF) is an augmented reality (AR) platform, ImagineAR.com, that enables businesses of any size to create and implement their own AR campaigns with no programming or technology experience. Every organization, from professional sports franchises to small retailers, can develop interactive AR campaigns that blend the real and digital worlds. Customers simply point their mobile device at logos, signs, buildings, products, landmarks and more to instantly engage videos, information, advertisements, coupons, 3D holograms and any interactive content all hosted in the cloud and managed using a menu-driven portal. Integrated real-time analytics means that all customer interaction is tracked and measured in real-time. The AR Enterprise platform supports both IOS and Android mobile devices and upcoming wearable technologies.

For more information or to explore working with Imagination Park, please email  [email protected], or visit www.imagineAR.com.

All trademarks of the property of respective owners.
ON BEHALF OF THE BOARD
Alen Paul Silverrstieen
President & CEO

(818) 850-2490
https://twitter.com/IPtechAR
https://www.facebook.com/imaginationparktechnologies
https://www.instagram.com/iptechar
https://www.linkedin.com/company/imagination-park-technologies-inc
We encourage you to do your own due diligence and ask your broker if Imagine AR Inc. (cse: IP) is suitable for your particular investment portfolio*.
The Canadian Securities Exchange has neither approved nor disapproved the contents of this press release. This press release may include ‘forward-looking information’ within the meaning of Canadian securities legislation, concerning the business of the Company. The forward looking information is based on certain key expectations and assumptions made by Imagination Park’s management. Although ImagineAR believes that the expectations and assumptions on which such forward- looking information is based are reasonable, undue reliance should not be placed on the forward-looking information because ImagineAR can give no assurance that it will prove to be correct. These forward-looking statements are made as of the date of this press release, and ImagineAR disclaims any intent or obligation to update publicly any forward-looking information, whether as a result of new information, future events or results or otherwise, other than as required by applicable securities laws.

Alen Paul Silverrstieen, President & CEO, (818) 850-2490

Is the #Esports business immune to COVID-19? – SPONSOR Esports Entertainment Group $GMBL $TECHF $ATVI $TTWO $GAME $EPY.ca $FDM.ca $TNA.ca

Posted by AGORACOM-JC at 6:14 PM on Tuesday, April 28th, 2020

SPONSOR: Esports Entertainment Group (GMBL:NASDAQ) – Millions of people from around the world tune in to watch teams of video game players compete with each other. In first quarter 2020, YouTube reported 1.1 billion hours watched, an increase of 13% when compared to fourth quarter 2019. Wagering on Esports is projected to hit $23 BILLION this year although that number will likely be eclipsed due to the recent pandemic. Esports Entertainment Group is the next generation online gambling company designed for the purpose of facilitating as much of this wagering as possible.  LEARN MORE.

Is the eSports business immune to COVID-19?

  • Where traditional sports are now dark, eSports have become the only competitive field available in the age of social distancing.
  • Worldwide now, people are spending more time playing video games than streaming videos or hanging out on social media sties, a revelation that speaks to the relative immunity of e-sports to COVID-19, according to Goff, who pointed out that Verizon reported gaming peak hour traffic increased by 75 per cent during the first week of lockdown in North America versus a 12-per-cent increase in video watching and no bump for social media.

by Jayson MacLean

With major league sports taking a time out due to COVID-19, eSports is now the hottest game in town, according to a new report from Echelon Wealth Partners analyst Rob Goff, who writes that gamblers and casinos are turning to e-sports as a way to fill the void.

The coronavirus pandemic has done a number on many sectors of the economy but perhaps nowhere is more of a ghost town than major league sports, leaving literally billions of fans with nothing to cheer for aside from computer simulations featuring their favourite teams and players and, of course, an end to the health crisis itself.

But where traditional sports are now dark, eSports have become the only competitive field available in the age of social distancing. Worldwide now, people are spending more time playing video games than streaming videos or hanging out on social media sties, a revelation that speaks to the relative immunity of e-sports to COVID-19, according to Goff, who pointed out that Verizon reported gaming peak hour traffic increased by 75 per cent during the first week of lockdown in North America versus a 12-per-cent increase in video watching and no bump for social media.

All of which is good news for the gaming companies, Goff said.

“The growth in the esports is acting as a catalyst for the gaming companies,” Goff wrote. “The increase in gaming related spending is close to online grocers driven by ongoing social distancing norms. We have seen double digit growth in the shares of Electronic Arts (+32 per cent), Take-Two Interactive (+27 per cent), Super League Gaming (+31 per cent), Sea Limited (+42 per cent), Bilibili (+50 per cent) in the last one month.”

Goff said that spending on digital games reached its highest monthly total ever in March, with growth in areas such as premium console sales and PC revenue altogether raising digital games revenue to $10.0 billion worldwide for March, up 11 per cent year-over-year and up eight per cent from February. At the same time, Twitter reported a 71 per cent jump in conversation about e-sports and gaming during the second half of March.

The rise in interest has propelled a number of stocks forward, Goff said, including two small Canadian companies, Fandom Sports Media (Fandom Sports Media Stock Quote, Chart, News CSE:FDM) and New Wave Esports (New Wave Esports Stock Quote, Chart, News CSE:NWES) whose share prices have shot up 5x and 2x, respectively.

At the same time, not all e-sports verticals are performing well, as those such as Activision-Blizzard’s Overwatch League depend on in-person events at arenas for their success.

Still, Goff points to gambling and casino interest in e-sports as another takeaway from the COVID-19 era. As evidence, the analyst pointed to Nevada’s Gaming control board which recently approved wagers on five e-sports leagues and the anticipated bet traffic for the three-day virtual NFL draft 2020.

“E-sports betting has benefitted from both sports postponements and temporary casino closures,” Goff wrote. “The lack of traditional sports betting markets has pushed some bookmakers, including William Hill, into esports as a possible solution to recoup lost revenues.”

Source: https://www.cantechletter.com/2020/04/is-the-esports-business-immune-to-covid-19/

#Palladium Weekly: Uptrend Set To Prevail This Year – SPONSOR: New Age Metals $NAM.ca $WG.ca $XTM.ca $WM.ca $PDL.ca $GLEN #PGM

Posted by AGORACOM-JC at 5:27 PM on Tuesday, April 28th, 2020

SPONSOR: New Age Metals Inc. The company owns one of North America’s largest primary platinum group metals deposits in Sudbury, Canada. The company has an updated NI 43-101 Mineral Resource Estimate of 2,867,000 PdEq Measured and Indicated Ounces, with an additional 1,059,000 PdEq Ounces Inferred. Learn More.

Palladium Weekly: Uptrend Set To Prevail This Year

  • We continue to believe that palladium benefits from the tightest fundamental backdrop, with the market likely to post a meaningful deficit in 2020 despite a contraction in automotive demand.
  • The negative seasonality in May-June could lead to some palladium price weakness, which we would view as a buying opportunity.

Thesis

Welcome to Orchid’s Palladium Weekly report, in which we discuss palladium prices through the lenses of the Aberdeen Standard Physical Palladium Shares ETF (PALL).

PALL has come under downward pressure since the start of April, despite a strong performance across the rest of the precious metals space.

The recent underperformance of palladium is driven by three main factors:

  1. Less exposure to South African PGM production disruptions
  2. More sensitivity to the recession in the automotive sector
  3. Less safe-haven demand

However, we continue to believe that palladium benefits from the tightest fundamental backdrop, with the market likely to post a meaningful deficit in 2020 despite a contraction in automotive demand for PGMs.

As a result, we expect the uptrend in PALL to prevail this year and next.

For Q2, we see PALL trading between $170 and $285 per share, implying a risk/reward skewed to the upside.

Source: Trading View, Orchid Research

About PALL

For investors seeking exposure to the fluctuations of palladium prices, PALL is an interesting investment vehicle because it seeks to track spot palladium prices by physically holding palladium bars, which are located in JPM vaults in London and Zurich. The vaults are inspected twice a year, including once randomly.

The Fund summary is as follows:

PALL seeks to reflect the performance of the price of physical palladium, less the Trust’s expenses.

Its expense ratio is 0.60%. In other words, a long position in PALL of $10,000 held over 12 months would cost the investor $60.

Liquidity conditions are poorer than that for platinum. PALL shows an average daily volume of $3 million and an average spread (over the past two months) of 0.33%.

Speculative positioning

Source: CFTC, Orchid Research

The speculative community slashed by the equivalent of ~2 koz its net long position in NYMEX palladium in the week to April 21, according to the CFTC. The NYMEX palladium price sold off by 6.3% over the corresponding period, suggesting the presence of additional selling pressure stemming from the OTC market and the physical market.

Since the start of the year, the speculative community has sold the equivalent of 1.053 moz of net long positions in NYMEX palladium, representing around 15% of annual supply. Despite this, the NYMEX palladium price is still up nearly 6% YTD. This highlights the fundamental strength in the physical market.

Because palladium’s spec positioning is very light (the net spec length is at just 10% of open interest), there is plenty of room for speculative buying pressure in case of a positive swing in sentiment among the speculative community.

Implications for PALL: The current spec positioning in NYMEX palladium is a potential bullish force for palladium prices due to the ample dry powder available to deploy among the speculative community. A renewed wave of spec buying in NYMEX palladium would push the NYMEX palladium price much higher, thereby boosting PALL in the process.

Investment positioning

Source: Orchid Research

ETF investors bought around 3 koz of palladium in the week to April 24, marking the 2nd week of net buying.

Given the weakness in automotive demand for palladium due to the COVID-19 crisis, the re-emergence of palladium ETF buying could help underpin the uptrend in the NYMEX palladium price. That said, we contend that it is too early to assert that a sustained positive change in investor sentiment toward palladium has occurred this month.

ETF investors have sold roughly 193 koz since the start of the year, marking a 28% decline in palladium ETF holdings.

Once again, despite the contraction in ETF demand for palladium, the NYMEX palladium price is up on the year. This shows the extent to which the physical palladium market is tight.

Implications for PALL: A resumption of ETF inflows in palladium would be bullish for the NYMEX palladium price and thus PALL.

Automotive demand

Last week, we discussed the supply side of the palladium market. This week, we discuss the outlook for automotive demand for palladium.

Source: Johnson Matthey

Palladium demand from the automotive industry represents around 85% of gross palladium demand, according to Johnson Matthey.

JP Morgan predicts a contraction of 13% in global light vehicle production this year, including a contraction of 25% YoY in the first quarter. In Q1, JP Morgan estimates that Chinese production contracted by 50% YoY while production dropped by 17% YoY both in North America and Europe.

This would translate into a decline of roughly 7% in automotive demand for palladium this year.

Source: JPM

Implications for PALL: The contraction in automotive demand for palladium should be largely offset by the contraction in palladium mine supply in 2020. As such, the palladium market is likely to remain in a meaningful deficit this year and post an even deeper deficit next year. As the fundamental tightness in the physical palladium market is set to prevail, we believe that the uptrend in PALL is intact for this year and next.

Closing thoughts

We expect the uptrend in PALL to prevail in 2020 and next year, principally because the palladium market is expected to post a meaningful deficit in spite of the recession in the automotive industry.

The extremely low level of visible inventories is likely to intensify the positive impact on palladium prices.

Given the negative seasonality in May-June, we stand ready to buy the dips in case of a retest of the recent lows.

For Q2, we see PALL trading between $170 and $285 per share, implying a risk/reward skewed to the upside.

Source: https://seekingalpha.com/article/4340578-palladium-weekly-uptrend-set-to-prevail-this-year

Else Nutrition $BABY.ca Announces Filing of Preliminary Base Shelf Prospectus $MAT $KMB $BMY $ABT $WYE

Posted by AGORACOM-JC at 12:25 PM on Tuesday, April 28th, 2020
  • Filed its preliminary base shelf prospectus
  • Filing of the Shelf Prospectus, when made final, will allow the Company to qualify the distribution by way of prospectus in British Columbia, Alberta and Ontario of up to C$20,000,000 of common shares, warrants to purchase common shares, units, or any combination thereof, during the 25-month period that the Shelf Prospectus is effective

Not for Distribution in the U.S. or to U.S. Newswire Services

VANCOUVER, BC / April 28, 2020 / Else Nutrition Holdings Inc. (the “Company” or “Else Nutrition” or “Else“) (TSXV:BABY) (OTCQB:BABYF) is pleased to announce that today it has filed its preliminary base shelf prospectus (the “Shelf Prospectus“) with the British Columbia Securities Commission, the Alberta Securities Commission and the Ontario Securities Commission. A copy of the Shelf Prospectus can be found on the Company’s SEDAR profile at www.sedar.com.

The filing of the Shelf Prospectus, when made final, will allow the Company to qualify the distribution by way of prospectus in British Columbia, Alberta and Ontario of up to C$20,000,000 of common shares, warrants to purchase common shares, units, or any combination thereof, during the 25-month period that the Shelf Prospectus is effective. Should the Company decide to offer securities during this period, the specific terms, including the use of proceeds from any offering, will be set forth in a related prospectus supplement to the Shelf Prospectus, which will be filed with the applicable securities commissions.

This press release shall not constitute an offer to sell or the solicitation of an offer to buy, nor shall there be any sale of these securities in any jurisdiction in which such offer, solicitation or sale would be unlawful prior to the qualification under the securities laws of any such jurisdiction.

About Else Nutrition Holdings Inc.

Else Nutrition GH Ltd. is an Israel-based food and nutrition company focused on developing innovative, clean and plant-based food and nutrition products for infants, toddlers, children, and adults. Its revolutionary, plant-based, non-soy, formula is a clean-ingredient alternative to dairy-based formula. Else Nutrition GH Ltd. (formerly INDI) won the “2017 Best Health and Diet Solutions” award at the Global Food Innovation Summit in Milan. The holding company, Else Nutrition Holdings Inc., is a publicly-traded company, listed on the TSX Venture Exchange under the trading symbol “BABY” and is quoted on the US OTC Markets QB board under the trading symbol “BABYF”. The Company’s Executive and Advisory Board includes leaders hailing from Abbott Nutrition, Mead Johnson, Boston Children’s Hospital, ESPHGAN (European Society for Pediatric Gastroenterology, Hepatology and Nutrition), Plum Organics, Tel Aviv University’s Sackler Faculty of Medicine, and Gastroenterology & Nutrition Institute of RAMBAM Medical Center.

For further information, please contact:

Ms. Hamutal Yitzhak, CEO of Else Nutrition
Email: [email protected]

Mr. Sokhie Puar, Director of Else Nutrition
Telephone: 604-603-7787
Email: [email protected]

Neither TSX Venture Exchange nor its Regulation Services Provider (as that term is defined in policies of the TSX Venture Exchange) accepts responsibility for the adequacy or accuracy of this release.

The securities described herein have not been registered under the U.S. Securities Act or any state securities laws, and may not be offered or sold in the United States absent registration or an applicable exemption from registration requirements under the U.S. Securities Act and any applicable state securities laws.

Certain information contained herein constitutes “forward-looking information” under Canadian securities legislation. Forward-looking information includes, but is not limited to, statements with respect to the Shelf Prospectus. Generally, forward-looking information can be identified by the use of forward-looking terminology such as “will” or variations of such words and phrases or statements that certain actions, events or results “will” occur. Forward-looking statements are based on the opinions and estimates of management as of the date such statements are made and they are subject to known and unknown risks, uncertainties and other factors that may cause the actual results to be materially different from those expressed or implied by such forward-looking statements or forward-looking information, including: the receipt of all necessary regulatory approvals, use of proceeds from the financing, capital expenditures and other costs, and financing and additional capital requirements. Although management of the Company has attempted to identify important factors that could cause actual results to differ materially from those contained in forward-looking statements or forward-looking information, there may be other factors that cause results not to be as anticipated, estimated or intended. There can be no assurance that such statements will prove to be accurate, as actual results and future events could differ materially from those anticipated in such statements. Accordingly, readers should not place undue reliance on forward-looking statements and forward looking information. The Company will not update any forward-looking statements or forward-looking information that is incorporated by reference herein, except as required by applicable securities laws.

AGORACOM Welcomes Eyecarrot Innovations $EYC.ca – Creating Faster Brains Through Stronger Eyes $EYPT $KALA

Posted by AGORACOM-JC at 11:50 AM on Tuesday, April 28th, 2020
Eyecarrot | LinkedIn

(TSXV:EYC) | (OTC:EYCCF) | (2EYA:GR)

Trusted and used by some of the world’s top professional sports teams, including:

Why Eyecarrot?

  • Eyecarrot Has Already Started Commercializing Its Vision Therapy Platform
  • Clients Include: 
    • Dallas Stars (NHL)
    • Chicago Cubs (MLB)
    • Sporting KC (MLS)
    • Tennis Canada
    • Showcased During NFL Scouting Combine
  • Company’s Vision Therapy Products Used In:
    • Over 1,500 Practices
    • 20 Countries
  • Flagship “Binovi” Is State-Of-The-Art Platform
    • Measures 14 Key Vision Skills
    • Essential For Maximizing Brain Performance
    • Shipped Over 400 Binovi Units (April 2020)
    • Goal Is 2,500 Binovi Units (End Of 2020)
  • Signed Sports Vision Partnership With Eli Wilson Goaltending
    • World Leader In Goaltending Development
    • 600 Active Goaltending Camp Participants
    • 50,000 Global Aspiring Goaltenders
  • Closed Major Financing In Q1 2020
  • Eyecarrot is now well positioned to further commercialize and capitalize on massive demand for Vision Therapy and Training For Athletes and Education

WHAT IS VISION THERAPY AND TRAINING?

1 in 4 people on the planet have vision problems that go beyond simply not being able to read those letters on the wall and requiring a prescription.

What your eyes see doesn’t always match up with what your brain sees.  Eyecarrot synchronizes your eyes and your brain to deliver maximum performance for athletes and students. 

The Company’s flagship product – Binovi – is a platform that measures 14 key vision skills essential for maximizing brain performance. Maximizing brain performance leads directly to making faster and better decisions, which directly correlates into an athlete or student’s best possible performance.

Result? Binovi delivers the performance edge everybody covets.  

More than just words, Binovi is already being used by many professional sports teams and has been tested by more than 1,500 vision performance professionals in over 20 countries.   

As a result, Binovi is quickly becoming an industry standard in the sports performance and vision rehabilitation markets.

http://www.smallcapepicenter.com/dallas.png

SEEING IS BELIEVING!

Now that you have a baseline understanding of the power of Eyecarrot, the next thing to do is see it for yourself. Watch this videos of Eyecarrot and Binovi in action, with some really happy users.

AS FEATURED ON BTV:

The Fed Can’t Print Silver SPONSOR: Affinity Metals $AAF.ca $SII.ca $TUD.ca $GTT.ca $AMK.ca $OSK.ca $RKR.ca

Posted by AGORACOM at 11:21 AM on Tuesday, April 28th, 2020
This image has an empty alt attribute; its file name is Affinity_Metals_Corp_Logo.png

Sponsor: Affinity Metals Corp. (TSX-V: AFF) is a Canadian mineral exploration company building a strong portfolio of mineral projects in North America. The Corporation’s flagship property is the drill ready Regal Property near Revelstoke, BC where Affinity Metals is making preparations for a spring drill program to test two large Z-TEM anomalies. Click Here for More Info

As a general rule, the most successful man in life is the man who has the best information Richard (Rick) Mills, Ahead of the Herd

April 27, 2020 (Investorideas.com Newswire) Silver prices will test $19 an ounce later this year on the back of heavy investment demand, as the coronavirus continues to depress markets and push investors in the direction of safe havens like precious metals.

That is the conclusion of The Silver Institute’s annual World Silver Survey, compiled by research firm Metals Focus and released in April.

Silver prices are driven by mine supply/ recycling and demand from both retail/ institutional investors and industry.

Over half of silver demand comes from industrial uses like solar panels, electronics and automotive parts. (Around 20 grams of silver are required to build a solar panel)

While most of the world’s mined gold is still around, either cast as jewelry, or smelted into bullion and stored for investment purposes, the same cannot be said for silver. It’s estimated around 60% of silver is utilized in industrial applications, leaving only 40% for investing. Of the 60% used for industrial applications almost 80% ends up in landfills.

The drop in demand for most goods and services owing to covid-19 doesn’t exempt silver – industrial fabrication is seen falling by 7%, along with jewelry and silverware offtake – but the report projects these declines will be offset by a 16% increase in silver bar and coin demand. There is also expected to be strong inflows into silver-backed ETFs as well as net buying by institutional investors on both the futures and OTC markets.

And while the white metal, sometimes called “poor man’s gold”, is expected to be in surplus again this year, the Silver Institute says the glut will be limited (to 14.7 million ounces, 53% smaller than in 2019), by a number of government shutdowns in top producers Mexico and Peru. As of April 3rd silver mine closures had restricted 40% of global production.

The Silver Institute therefore expects silver prices, currently trading around $15 an ounce, to hit $19/oz before year-end, possibly even outperforming gold on the back of its historically low relative value. If that happens, it would be a repeat of silver’s pattern last year.

Catching gold’s wave

In analyzing silver we also need to look at gold. The precious metals often follow each other’s price movements and they are frequently found together in mineral deposits.

Silver and gold both spiked last summer after the US Federal Reserve began cutting interest rates to deal with slowing global growth and signs of a worsening US economy. In July the Fed lowered rates three times before freezing the federal funds rate at a range of 1.5 – 1.75%. (they have subsequently been cut to near 0%)

Rate cuts, along with similarly dovish policies among other central banks, a record $17-trillion of negative-yielding sovereign debt, and safe-haven demand due to tensions with Iran, to name a key issue, powered the precious metals to new heights.

Silver prices rose 15% in 2019, helped by a 12% increase in silver investment demand – the highest annual growth since 2015. 

The onset of the coronavirus, first appearing as an epidemic in China, then spreading to Iran and South Korea, before becoming a full-blown pandemic in mid-March, has meant high volatility for gold and silver.

We’ve seen gold spike on safe-haven demand, as investors piled into gold ETFs, US Treasuries and the US dollar, only to fall sharply mid-March, as traders sold their gold holdings to cover losses in other assets

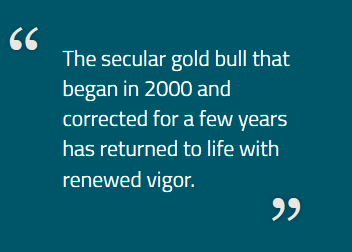
Since the beginning of April gold has surged, reclaiming $1,700/oz on the back of a record $2.2 trillion spending package announced by the US government, to combat the economic fallout from covid-19.

Other central banks have launched huge stimulus measures to head off, or more likely dampen, the effects of a global recession or even depression.

On April 14 Comex gold futures for June delivery vaulted to $1,785 an ounce, the highest since October 2012. Although gold prices have slipped back a bit, currently trading around $1,720/oz, some analysts see the potential for another leg up. Bloomberg quoted Hans Goetti, founder and chief executive officer of HG Research, saying:

“What’s happening here is that the Fed is expanding its balance sheet and every other central bank in the world is doing the same,” he told Bloomberg TV. “What you’re looking at is massive currency debasement in the long term. That’s the major reason why gold is higher, and I would think that over the next few weeks or months, we’re probably going to retest the high that we saw in 2011” (when gold passed an all-time high of $1,900/oz).

Another factor in gold’s favor is negative real interest rates.

Many countries including the United States have seen bond yields approach or even go below 0%. When real rates (yield minus rate of inflation) turn negative, investors tend to rotate from bonds into gold.

And while securities analysts quoted by Bloomberg expect the Federal Reserve’s renewed quantitative easing, combined with large fiscal stimulus (spending), could see long-end rate rise during the recovery phase of coronavirus, they don’t see that happening without inflation, “which should keep real rates suppressed.”

This week, Bank of America released a forecast predicting gold will rocket as high as $3,000 an ounce within 18 months.

According to Marketwatch, BofA Global Research raised its 18-month price target from an earlier $2,000, citing the prospects of endless monetary expansion from central banks, including the Federal Reserve, to limit the economic damage from the COVID-19 pandemic.

“The rather lofty upside gold price forecast from Bank of America continues to echo in the marketplace with the widely publicized quote ‘the Fed can’t print gold’ a very strong point for the bull camp,” analysts at Zaner Metals wrote in a daily update.

As we showed in a previous article, there is a close relationship between gold and debt-to-GDP ratios.

Undervalued silver

Gold and silver prices are often compared, to get a sense of which direction each are headed. The gold-silver ratio is the amount of silver one can buy with an ounce of gold. Simply divide the current gold price by the price of silver, to find the ratio.

When gold is over-valued compared to silver, investors take advantage of the arbitrage opportunity, by selling some of their gold holdings to buy silver. The opposite occurs when silver is over-valued compared to gold. In that situation, precious metals investors sell silver to buy gold.

The higher the number, the more undervalued is silver.

The current gold-silver ratio, 113:1, is double the historical ratio of 50-60 ounces of silver to one ounce of gold, meaning that silver is highly undervalued compared to gold. It means an investor with an ounce of gold could sell his gold for 113 ounces of silver.

All the bullish factors for gold are in place: a “black swan” event that has created huge fear and uncertainty, imploding global stocks and sending traders/ investors flocking to the safety of havens like the US dollar, US Treasuries and precious metals. The demand for Treasuries has pushed up their prices, causing their yields to fall to new lows. Negative real yields (yields minus inflation) are bullish for gold, and we expect real yields to remain negative for some time.

Remember, gold rises proportionally to debt. As long as governments are wrangling the coronavirus, we fully expect national debt piles to keep growing. Indeed the political pressure on governments to help the most vulnerable in society, for fear not only of losing power, but in some countries, extreme social unrest, is bound to keep the stimulus taps gushing.

While demand for silver, like for most industrial metals, will fall during this period of virus-related uncertainty, after the pandemic is beaten, we expect it to come roaring back, and the extremely out-of-whack gold-silver ratio to correct, in silver’s favor.

Silver mines, ranked

Silver supply is sensitive to mine production cuts – as we have seen recently with coronavirus-related stoppages. However, silver is also vulnerable to supply slippage, more so than gold, because there are relatively few pure-play silver mines.

Only around 30% of annual supply comes from primary silver mines while more than a third is produced at lead/zinc operations and a further 20% is from copper mines. Over two-thirds of the world’s silver resources are sourced from polymetallic ore deposits.

That makes silver quite a bit different from gold, in that primary gold deposits, with relatively few other minerals, are common. Large deposits of gold are also found in copper-gold porphyries.

Not so for silver, which most often has to be coaxed out of lead and zinc ores, followed by mines specializing in copper and gold, in that order.  Only twenty eight percent of global silver production is sourced from primary silver mines. Last year’s World Silver Survey delineated the world’s largest primary silver mines. Topping the list was Fresnillo’s Saucito mine in Mexico, which in 2018 produced 19.9 million ounces. Second spot went to Polymetal’s Dukat mine in Russia (16.5Moz), followed by Buenaventura Mines’ Uchucchacua mine in Peru, producing 15.4Moz. According to the US Geological Survey, Mexico is by far the largest producer, outputting 6,300 tonnes in 2019, followed by Peru and China, at a respective 3,600t and 3,800t. Next on the list are Russia, Poland and Australia. Global silver production in 2019 totaled 27,000 tonnes, or 868 million ounces. 

Where are the world’s largest silver mines, including mines that produce silver as a by-product of other metals?

The 2020 Silver Survey has KGHM Polska Miedz’s three copper-silver mines in Poland – Lubin, Rudna and Polkowice-Sieroszowice – leading by a long shot, at 40.2Moz in 2019.

That is almost twice the production of number 2 Penasquito (22.7Moz) and over double Dukat’s 19.3Moz. Saucito, ranked highest last year in primary silver mine production in 2020, is the fourth-largest mine in the world containing silver and other metals.


Poland’s Kupferschiefer silver

State-run Polska Miedź (KGHM) is the second largest silver producer in the world, behind only Fresnillo, and the sixth biggest copper miner. 

Why is so much silver produced from one company, KGHM Polska Miedz, versus Mexico and Peru, which are more closely associated with silver mining?

To know the answer, we must first understand Poland’s giant “Kupfershiefer” copper-silver deposits, of which the Lubin, Rudna and Polkowice-Sieroszowice mines, containing 1.4 billion ounces of silver reserves, are a significant part.

Sedimentary-hosted stratiform copper deposits are among the two most important copper sources in the world, the other being copper porphyries. They typically range from 1.6 million to 170 million tonnes copper ore, grading between 0.7% and 4.2%, with a median of 14 million tonnes at an average grade of 1.6% Cu, according to a 2019 academic paper, ‘The Kupferschiefer Deposits and Prospects in SW Poland: Past, Present and Future’.

Sedimentary copper deposits are formed in ocean basins, where copper and other minerals travel up through porous lithologies such as sandstone and become trapped in the upper sequence of sandstone and overlaying it black shale and limestone.

Red-bed deposits, so named due to oxidation resulting from exposure to the atmosphere, are divided into volcanic and sedimentary.

Kupferschiefer deposits are similar to red-beds but larger, even regionally extensive. They typically form in a marine setting, after land is gradually submerged into a shallow sea, then overlain by sedimentary rocks – which formed from the gradual deposition of the carcasses of dead sea creatures, onto the ocean floor.

A classic “Kupferschiefer” consists of three main layers – sandstone, bituminous shale and limestone overlain by evaporates often containing oil and gas. Copper-containing fluids migrate up through the sandstone and get trapped by the carbon-rich copper shale. This is where most of the mineralization is concentrated, although it can also be found in the sandstone, limestone, or a combination of all three layers.

The Kupferschiefer copper belt that underlies Germany and Poland is among only three giant sediment-hosted copper deposits in the world. It is also within an elite 1% of deposits that contain over 60 million tonnes of copper.

Orebodies can range in thickness from 0.3 m, contained largely within the black shale of the Kupferschiefer sensu stricto, up to more than 50 m, where sublevel stoping, backfilling, and pillar mining reflect the pervasive mineralization, states a research paper.

According to the Polish Geological Institute, Poland holds the largest economic copper resources in Europe, about 36 million tonnes, and the most anticipated economic silver resources on the continent, about 3.4 billion troy ounces.

Other metals recovered from copper ores at Poland’s Kupferschiefer deposits include gold, platinum, palladium and rhenium.

Despite being a small country, about the size of New Mexico, Poland produced 54.6 million ounces of silver in 2019, up 18% from 2018, mainly as a product of copper mining.

The richest silver deposits are located in the Lower and Upper Silesia regions, where the first shallow mines pre-date the Roman Empire, going back as far as 1136 AD.

According to the US Geological Survey, the massive volume of metal in Poland’s Kupferschiefer deposits is due to continuous mineralization that extends down dip and laterally for kilometers.

Identified resources within the giant Lubin-Sieroszowice deposit, are 1.6 billion tonnes of ore containing 30.3 million tonnes of copper and 2.7 billion ounces of silver, at average grades of 1.63% Cu and 57 g/t Ag. Reserves are 23.7 million tonnes copper and 1.4 billion ounces silver.

The strongest copper sulfide mineralization occurs in the black clay shales, including chalcocite, bornite, covelline and chalcopyrite, accompanied by minerals associated with silver, native silver, lead, zinc, cobalt and nickel.

A comparison at this point is interesting. #1 primary silver mine Saucito contains 130.3Moz in reserves, at an average silver grade of 272 g/t Ag. #2 is Dukat, with 93.4 Moz in reserves averaging 4.1 g/t Ag. The third largest primary silver mine, Uchucchacua, has 98.5Moz at 294.2 g/t.

Lubin-Sieroszowice dwarfs all three, at 10 times the reserves of Saucito, 15 times those of Dukat, and 14 times Uchucchacua’s. (Saucito and Uchucchacua are admittedly much higher-grade)

Minerals from three underground mines – Lubin, Polkowice-Sieroszowice and Rudna – are extracted using the room and pillar method at depths of between 600 and 1,250 meters. Expected minelife is 50 to 60 years, producing at a rate of 30 million tonnes a year. Consider that three of the four original mines have been producing since the late 1960s. They’ve already been going for 50+ years, yet they have another 50-60 more years to go and mineralization is open down dip.

The earliest exploration dates back to 1914, when German geologists conducted studies of the Zlotoryja region, and later, Grodziec. The first mine, Lena, started in 1936 but production was halted due to the onset of World War Two.

In 1959, 24 drill holes outlined the Lubin-Sieroszowice deposit, found at depths of between 400 and 1,000 meters. A resource estimate tallied indicated resources of 1.364 billion tonnes of ore grading 1.42%, containing 19.34 million tonnes of copper and about 1.157 billion ounces of silver.

Copper mining began in 1968 with the commissioning of two mines, Lubin and Polkowice.

According to KGHM’s 2019 results, the Lubin, Polkowice-Sieroszowice and Rudna mines produced 1,400 tonnes of silver last year, or 45 million ounces, at an average 48.7 g/t Ag.

In 2014, a project called “Deep Glogow” began mining from below the 1,200m level, using infrastructure from Rudna and Polkowice-Sieroszowice. The project contains 265.5 million tonnes grading 1.6% copper and 54 g/t silver, and has a minelife of 40 years.

There are also three undeveloped deposits to the north with identified resources (2018) of 139,535 million tonnes of ore including 2.2 million tonnes of copper and 356.3 million ounces of silver. And this year, 2020, Zielona Góra Copper (a Canadian company) documented a new Cu-Ag deposit “Nowa Sól” located northwest from the Lubin area. This new deposit has an estimated resource of 848 MT of copper and 0.036 MT of silver.

CESAR copper+silver project

The reason we have spent so much time writing about Poland’s Kupferschiefer is because of Max Resources (TSX.V:MXR).

Since November, Max’s geological teams have been identifying copper and silver targets within a 120 km x 20 km area, at their CESAR copper+silver project in northeastern Colombia.

Max field crew has been mapping copper-silver bearing stratabound horizons, rock chip channel sampling across mineralized beds and wall rock and following continuity of identified horizons along strike, to determine potential size prior to drilling.

The Vancouver-based company sees similarity of mineralization at the CESAR project to Kupferschiefer as a new giant sediment-hosted coppersilver mineralized system.

In a Feb. 27 news release, Max notes that its recent AM North and AM South discoveries are hosted in well-bedded sandstone-siltstone similar to KGHM’s monster “Kupferschiefer” mines in Poland.

In an earlier interview with AOTH, Max’s head geologist, Piotr Lutynski, said Colombia’s stratigraphy is similar to his homeland, Poland, and its cluster of Kupferschiefer sediment-hosted copper-silver deposits.

The last news release from CESAR concerns the AM South discovery – which features a stratabound copper-silver horizon, with mineralized structures totaling over 5 km of strike length. Earlier this year, sampling from 0.1 to 25-meter intervals returned highlight values of 5.4% copper and 63 g/t silver.

Having recently discovered a 10-meter by 2-meter panel which returned copper and silver grades of 3.5% Cu + 26 g/t Ag, the 1.4-km stratabound copper-silver horizon has been extended 1,000m, to 2,400m. (2.4 km).

Max also reported a new discovery, AM-2, located 500 meters south of AM-1. The new zone extends for 1,000 meters, and is open along strike and dip. The fact that it is parallel to AM-2 strongly suggests stacked horizons.

Assays at AM-2 are pending.

The CESAR project and its potential to be a Kupfershiefer analogue has grabbed the attention of one of the most important research centers in the world for the study of these sedimentary-hosted stratiform copper deposits which are also large repositories of silver.

In the press release below, Max says it has sent surface rock samples extracted from CESAR’s stratabound copper-silver mineralization horizons to the University of Science and Technology’s Department of Economic Geology, located in Krakow, Poland. Researchers at the university, which has worked extensively with KGHM in Poland, will conduct mineralogical and geochemical studies on the samples; also, a Masters-level student is planning on writing a thesis paper on the results.

Vancouver B.C., April 21, 2020 – MAX RESOURCE CORP. (“Max” or the “Company”) (TSX.V: MXR; OTC: MXROF; Frankfurt: M1D2) is pleased to report the involvement of the University of Science and Technology (“AGH-UST”), Faculty of Geology, Geophysics and Environmental Protection, Department of Economic Geology (“AGH”), Krakow, Poland in a study of the sediment-hosted copper-silver mineralization of the CESAR project, located 420-km north of Bogota, in NE Colombia.

Max has dispatched surface rock samples extracted from the CESAR stratabound copper-silver mineralized horizons to AGH. From these samples, AGH will conduct various mineralogical and geochemical studies.

AGH Professors and teaching staff have a long history of cooperation with KGHM Polska Miedz (“KGHM”), the largest copper producer in Europe and the worlds largest silver producer. AGH will leverage their extensive knowledge of KGHM’s world renowned Kupferschiefer sediment-hosted copper-silver deposits in Poland, on the academic study of CESAR.

Max and AGH agreed that results from the study on CESAR may be used for public presentations and scientific papers. In addition, discussion have commenced with respect to an AGH M.Sc. student focusing their thesis on selected material sent from the CESAR project.

AGH-UST in Krakow, Poland has a distinguished history and a deep understanding of sediment-hosted copper-silver deposits, due to their extensive work with Kupferschiefer, established in Poland as a world-class producer of copper and silver since 1968, also producing, gold, palladium, platinum and rhenium as by-products.

“We anticipate the scientific team from the Department of Economic Geology will play a significant role in identifying the similarities with Kupferschiefer and unlocking the ultimate potential of CESAR,” Max CEO, Brett Matich, commented.

“Max’s CESAR project in Colombia provides for significant exposure to both copper and silver, and notably silver has increased from a low of $11.74 per ounce in March to a high of $16.06 in April,” Mr. Matich concluded.

Max cautions investors that mineralization at Kupferschiefer is not necessarily indicative of similar mineralization at CESAR.

Conclusion

Investment demand for silver looks solid, with no end in sight to the low-interest-rate/ loose monetary policy direction of central banks, combined with record-breaking stimulus packages being passed by governments, as the coronavirus crisis rages on.

Adding higher demand due to shrinking silver supply, lower grades, and less by-product credits from falling lead and zinc mine production, we see a floor forming under silver prices.

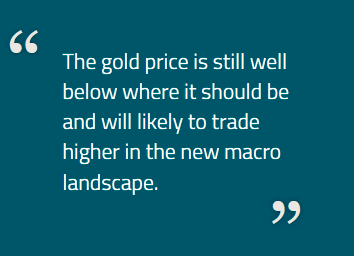
The 113:1 gold-silver ratio is very high by historical standards. This is a warning to investors that at any time, the ratio could correct, either meaning a move up in silver prices or a move down in gold prices. Trust me, gold is not going down anytime soon, meaning silver prices must eventually correct.

The coronavirus has lit a fire under gold prices, which have burned past $1,720 an ounce. Historically, silver rides the wave started by gold.

As long as governments are wrangling the coronavirus, we fully expect national debt piles to keep growing. Gold prices rise proportionally to debt.

Consider what a $10 trillion Fed balance sheet will do to the debt-to-GDP ratio. Consider what it will do for gold and silver!

Despite broad-based market volatility, now is an unbelievably good time to be investing in precious metals. Buying physical gold and silver won’t hurt you, but high prices do not make an attractive entry point and we don’t see a significant pullback happening anytime soon.

Historically, and especially so today, the greatest leverage to rising precious metals prices has been owning the shares of junior resource companies focused on acquiring, discovering and developing precious metals deposits.

Identifying who owns the most attractive silver, in the ground, that can be bought at historically low valuations would seem to me a very prudent investing strategy at the moment.

For the last several months I’ve been following Max Resource Corp. as it develops CESAR. Max’s goal is to bring in a major as a partner, that can help finance a drill program at CESAR and bring it to a resource, then, fingers crossed, complete the rest of the steps (PEA, prefeasibility study, feasibility study, permits, etc.) required to build a mine.

We are also encouraged to see interest expressed by AGH-UST university in Poland, where some of the people most familiar with Kupfershiefer-type deposits, other than KGHM, will study samples from Max’s CESAR to see if there is a correlation. That’s exciting.

Could Max be sitting on another Kupfershiefer? Time will, as always, tell. But by the time we get a definitive answer I would expect the share price to have already runaway.

Richard (Rick) Mills

subscribe to my free newsletter

aheadoftheherd.com

Source:https://aheadoftheherd.com/Newsletter/2020/The-Fed-cant-print-silver.htm

Secular Gold Bull Resumes with Force SPONSOR: American Creek $AMK.ca $TUD.ca $SII.ca $GTT.ca $AFF.ca $SEA.ca $SA $PVG.ca $AOT.ca $ESK.ca

Posted by AGORACOM at 9:54 AM on Tuesday, April 28th, 2020

SPONSOR: American Creek owns a 20% Carried Interest to Production at the Treaty Creek Project in the Golden Triangle. 2019’s first hole averaged 0.683 g/t Au over 780m in a vertical intercept. 2020 drilling plans 18,000 to 20,000 metres from 7-10 drill platforms with four diamond drill rigs. The Treaty Creek property is located in the same hydrothermal system as the Pretivm and Seabridge’s KSM deposits and is fully funded for exploration in 2020. Click Here For More Info

COVID-19: The Pin that Punctured the Credit Balloon

Gold is on the cusp of breaking out to all-time highs in U.S. dollars and has already done so in virtually every other currency. Gold mining stocks continue to lag the metal and, in our opinion, represent a compelling investment opportunity at this moment. The COVID-19 pandemic panic was merely the black swan that punctured a financial market asset bubble that took almost a decade to inflate.

Think of the pandemic as the pin that punctured the credit balloon. In a few months, the pandemic will ease (hopefully) with the formulation of a COVID-19 vaccine, widespread testing and other responses that will surely come from the healthcare industry. However, the fiscal and monetary policy damage committed by all governments to save the world has created a debt hangover that will linger for years. Economic growth will rebound but only to subpar levels once extreme health-related restrictions are lifted and “stimulus” kicks in.

The requisites for robust economic growth most likely to misfire are investment confidence and bank lending. Both have been severely compromised. Whether this landscape evolves into a long stretch of deflation or combusts into untamed inflation remains to be seen. What seems quite apparent is that traditional Keynesian stimulus measures are in their endgame. They will most likely deliver only steadily diminishing returns. Starkly opposite economic outcomes are possible from this policy morass; both would be positive for gold but negative for real returns on fixed income or equities.

Q1 Marks a Pivotal Turning Point for All Asset Classes

As of this writing, gold is trading about 10% less than its all-time high of US$1,900 attained nine years ago (September 2011). In effect, it has gone nowhere for a decade despite a tectonic shift in the investment and economic outlook. A lengthy correction lasting until 2016 and subsequent churning resulted in the establishment of a powerful multi-year basing structure. From this base and with strong macroeconomic tailwinds, we believe new highs well above $1,900 can be achieved over the next four years.

Despite enthusiastic advocacy and much chatter from investment luminaries, including Ray Dalio, Jeff Gundlach, Seth Klarman and others, gold remains severely and inappropriately underrepresented in the portfolios of fiduciaries, endowments and family offices. Flows into channels such as gold-backed exchange traded funds (“ETFs”) have been strong relative to previous low levels, but must still be considered a trickle in terms of what could still come. 

 Figure 1. Gold-Backed ETFs Reach Record Levels
Global gold-backed ETFs added 298 tonnes and net inflows of US$23 billion in Q1 2020 — the highest quarterly amount ever in absolute U.S. dollar terms and the largest tonnage additions since 2016.
Source: World Gold Council. Data as of 3/31/2020.

In our opinion, the first quarter of 2020 will mark a pivotal, secular turning point for all major asset classes including equities, bonds, gold and currencies. A return to the pre-2020 financial market normalcy and investment complacency is unlikely. In our view, consensus hopes remain high that the credit smash is only a temporary repercussion of the health scare. We disagree and suggest the effects will be long lasting.

Despite the solid price gains achieved by gold in the past two years, there is much more upside to come as investors gradually give up on repeated equity market bottom fishing and the hope of a return to financial market normalcy. A full reversal to the previous complacency cannot take place following a brief crash. The mood change will more likely become pervasive after grueling stretches of disappointing returns from previously successful investment strategies.

Unprecedented Central Bank Monetary Expansion

In our view, the decade preceding 2020 was characterized by the systematic stifling of price discovery for interest rates and the appropriate dependent valuations for financial assets. Such distortion was made possible only by unprecedented central bank balance sheet expansion that encouraged, abetted and rewarded risk taking in the form of ever greater leverage.

The prolonged somnolence of gold was among the most egregious price distortions of the previous decade and this suppressed interest in the metal as a risk mitigator and portfolio diversifier. Disinterest was fed in large part by the nearly universal expectation that the past would always be prologue and that highly leveraged financial and economic structures would perpetually result in outsized returns. In our view, the greatest change stemming from the credit bust will be a mood shift or paradigm change in the opposite direction.

At gold’s previous peak in 2011, the combined balance sheets of the U.S. Federal Reserve (“U.S. Fed”) and the European Central Bank (“ECB”) totaled approximately US$5.5 trillion. Today, that number is more than $11.4 trillion and rapidly moving higher. The USD gold price is still lower than nine years ago. In our view, gold price is still well below where it should be and will likely trade higher in the new macro landscape.

 Figure 2. Pandemic Policy Response Pushes Global Balance Sheets to Record Levels
Source: Bloomberg. Data as of 3/31/2020.

Gold Mining Stocks are Inexpensive

If gold is not correctly priced for what has transpired and what lies ahead, gold mining stocks are even more inappropriately priced. Based on current metal prices, most companies are generating positive earnings and cash flow and in many cases, free cash flow that can be applied to higher dividend payouts. Compared to other sectors of the economy, the gold mining industry stands almost alone in looking forward to strong 2020 earnings and a positive outlook for 2021.

2020 free cash flow yields for large-cap producers range from 3%-7% and 6%-25% for intermediate producers based on conventional sell-side research. The stats are similar or better for 2021 based on spot gold prices. As Figure 3. shows, mining stocks are inexpensive in absolute terms and have never been so cheap relative to the gold price. 

Figure 3. Gold Equities Are Undervalued Relative to Bullion
Ratio of XAU Index to Spot Gold (12/23/1983-3/31/2020)
Data as of 3/31/2020. Source: Bloomberg. 12/23/1983 represents the inception of the XAU.

Since 2008, the relative valuation of gold equities to gold bullion has fallen 75% from the prior 25-year average. The ratio of the XAU Index to spot gold averaged 0.2497x for a quarter century through 2008. As of 3/31/2020, the ratio was 0.0501x.

It is undoubtedly true that the industry will suffer health-related mine shutdowns and other shortfalls this year. Much of the disruption potential has already been broadcast and priced into the market. Some downside news may still have yet to surface. However, most miners are not financially levered and should be able to survive a few quarters of lower or no production. Unlike the airline, leisure, retail and manufacturing sectors, gold not produced today should grow in value and be produced at higher prices and lower costs next year and those beyond. It is not the same story for many other sectors of the economy. Based on fundamentals, gold stocks are inexpensive. By contrast, several other sectors of the economy could face long stretches of poor earnings, bad news flow and financial woes.

The gold mining sector registered a decline of approximately 20% in Q1 (as measured by GDX2) as shares did get battered by indiscriminate liquidations during March. However, as of this writing, two weeks after the close of the quarter, most shares trade near to where they stood at the beginning of the year, and have certainly registered outstanding performance in relative terms. It is remarkable that the largest sector ETF, GDX, suffered outflows of $381 million3 during the quarter at what could be the threshold of an upside breakout. In a favorable cycle for the gold price, mining stocks have historically delivered outperformance 3 to 5 times that of the metal itself.

Gold mining shares continue to be viewed by investors with deep skepticism as reflected by valuation and flows. When we scan Figure 4, it appears to us that the sector is on the verge of an upside breakout from a multi-year base should our assessment of the macroeconomic environment prove correct.

Figure 4. NYSE Arca Gold BUGS Index (HUI4)
Source: Bloomberg. Data as of 4/20/2020.

Monetary and Fiscal Policy Going Ballistic

There is no need to belabor the obvious. However, the consequences of these actions have yet to be priced into the financial markets or gold. The risk parity trade has fallen short, partly because bonds were caught up in the indiscriminate liquidations of Q1. Looking forward, bonds may no longer be able to play the safe haven role they traditionally filled to balance equity risk. The vacuum could be filled in part by increased gold exposure for all classes of investors. Sovereign credit liquidity injections are likely to remain significant and permanent. The bond market has become socialized. Owning Treasury bonds of any duration could become akin to parking Treasury bills, with little upside and considerable risk of impairment through inflation. Gold is the antidote to the fixed-income investor’s dilemma.

Gold is extremely under-owned, under-represented, and poorly thought of in the circles of conventional investment thinking. It is still considered to be a fringe asset. Just ask Goldman Sachs which recently advised its clients:

 “We concluded then (2010) that gold does not have a role as a strategic asset class in clients’ already well-diversified portfolios. We have updated the research and the evidence is even more compelling today than it was then.” (4/5/2020; Goldman Sachs Investment Strategy Group)

We remind the reader that Goldman is the same firm that in December 2019 declared the U.S. economy to be “recession proof” and then in March 2020 cautioned that stocks had substantial further downside:

“Overall, the changes underlying the Great Moderation appear intact, and we see the economy as structurally less recession prone today.” (12/31/2019; Goldman economists Jan Hatzius and David Mericle)

“Goldman Sachs on Friday dramatically cut its U.S. economic forecast, saying it now expects GDP to decline by 25% in the second quarter of 2020 because of the coronavirus panic.” (3/20/2020; Business Insider)

“What is your estimate for the S&P 500 by yearend 2020? David Kostin, “3400.” (1/2020; GS Podcast, David Kostin Goldman, U.S. chief equity strategist and Jake Siewert) 

“Kostin thinks the market goes lower. ‘In the near term, we expect the S&P 500 will fall towards a low of 2000.’” (3/22/2020; Yahoo Finance)

Goldman’s commentary is, in our opinion, a reasonable proxy for conventional wisdom. One could easily find other embarrassing examples of mainstream thinking ignorant of the best-performing asset class (by far) versus equities and bonds since 2000.

Contrarians and value investors, take note! The secular gold bull that began in 2000 and corrected for a few years has returned to life with renewed vigor. Pullbacks — price declines during this uptrend — should be bought. The setup for gold and gold mining shares ticks every box for highly rewarding investment returns.

Figure 5. Gold Has Outperformed Stocks, Bonds and USD over the Past 20 Years
Returns for Period from 12/31/1999-4/13/2020

Source: Bloomberg. Period from 12/31/1999-4/20/2020. Gold is measured by GOLDS Comdty; US Agg Bond Index is measured by the Bloomberg Barclays US Agg Total Return Value Unhedged USD (LBUSTRUU Index); S&P 500 TR is measured by the SPX; and the U.S. Dollar is measured by DXY Curncy. Past performance is no guarantee of future results.

Figure 6. Gold Provides Portfolio Diversification
Gold provides diversification in a portfolio, and has low correlation with other asset classes. The period measured is April 1, 2015 to April 1, 2020.

* Source: World Gold Council. Period from April 1, 2015 to April 1, 2020, based on monthly returns. Gold is measured by the LBMA Gold Price; stocks by the S&P 500 Index; commodities by the Bloomberg Commodity Index;  Bonds by the BarCap Treasuries and Corporates.

1The S&P 500 or Standard & Poor’s 500 Index is a market-capitalization-weighted index of the 500 largest U.S. publicly traded companies. You cannot invest directly in an index. TR, “Total Return”, represents the index with dividend income reinvested.
2VanEck Vectors Gold Miners ETF (GDX) seeks to replicate the NYSE Arca Gold Miners Index (GDMNTR), which is intended to track the overall performance of companies involved in the gold mining industry.
3Source: ETFtrends.com.
4The NYSE Arca Gold BUGS Index (HUI) is a modified equal dollar weighted index of companies involved in gold mining.

SOURCE: Sprotts Thoughts

https://sprott.com/insights/sprott-gold-report-secular-gold-bull-resumes-with-force/#