Posted by AGORACOM
at 11:25 AM on Monday, December 2nd, 2019
SPONSOR: Advance Gold AAX.v – Advance Gold controls 100% interest in the Tabasquena Silver Mine in Zacatecas, Mexico. A cluster of 30 Epithermal veins have been discovered, with recent emphasis on exploring a large anomaly to drill. Advance also owns 13.5% of the Kakamega JV attached to Barrick Takeover Offer for Acacia Mining. Click Here For More Info
Just 215.5 million ounces has been discovered in 41 discoveries over the past decade, compared with 1.72 billion ounces in 222 discoveries in the preceding 18-year period.
S&P Global Market Intelligence’s annual Gold Discoveries report found that gold exploration budgets peaked in 2012, but remain at historically high levels.
Explorers have allocated US$54.3 billion to gold exploration over the
past decade, 60% higher than the $32.2 billion spent over the preceding
18 years.
Despite the effort, just 215.5 million ounces has been discovered in
41 discoveries over the past decade, compared with 1.72 billion ounces
in 222 discoveries in the preceding 18-year period.
Over half of that amount is contained in just 10 discoveries, with
Zhaojin Mining Industry Co’s 16.4Moz Haiyu deposit in China the largest.
Other deposits in the top 10 including Barrick Gold’s Goldrush, White
Rivers Exploration/Harmony Gold’s JV, SolGold’s Cascabel and Cardinal
Gold’s Namdini.
S&P says that even after adjusting for more recently identified
deposits that might eventually surpass its threshold for a major
discovery, and for major discoveries with potential to expand, it
forecasts that the gold in major discoveries might only increase to
about 363Moz over the next decade.
S&P Metals & Mining senior research analyst Kevin Murphy said
previous research into gold lead times showed that it took about 20
years for an asset to advance from early exploration to production.
“This timeline implies that the reduced discovery rates of the last
decade will limit the pool of projects that could come online in 15 to
20 years,” he said.
“Unless discovery rates begin an upswing in the near future, there
could be a lack of quality assets available for development in the
longer term.
“The declining discovery rate shows the importance of continuing
exploration and funding companies responsible for exploration to
maintain a healthy future pipeline of assets available for development.”
Majors Barrick and Newcrest Mining reported declines in reserves this year.
Barrick’s reserves dropped to 64.4Moz from 86Moz, mainly due to
divestments and reclassification, while Newcrest’s dropped by 3Moz to
62Moz.
Newmont Mining’s remained unchanged at 68.5Moz, though the average grade fell by 5%.
Newmont has increased its 2018 exploration budget to US$350-400
million from $200 million last year, Barrick is boosting its spend to
$185-225 million from $149 million, and Newcrest is spending $70-90
million in FY18, up from $58 million.
Posted by AGORACOM
at 2:33 PM on Wednesday, November 27th, 2019
Kamloops,
British Columbia–(Newsfile Corp. – November 27, 2019) – Advance Gold
Corp. (TSXV: AAX) (“Advance Gold” or “the Company”) is pleased to
announce drilling has started to test the large chargeability anomaly
identified in recent 3D Induced Polarization (IP) geophysical surveys on
its Tabasquena project in Zacatecas, Mexico. Two phases of IP surveys
identified a 1000 metres by 500 metres continuous chargeability anomaly.
The anomaly remains open to the north and to the south and at depth.
Allan Barry Laboucan, President and CEO of Advance Gold Corp. commented: “We
are very excited to drill this large chargeability anomaly as these
kinds of targets are not easily found, especially in regions well known
for big mines. What makes it particularly stand out is that the high
chargeability is consistent from east to west on each survey line, and
from line to line over the entire grid. One always has to be aware of
possible false positives, such as the possibility of disseminated
magnetite causing the chargeability anomaly. However, in this case there
has been no magnetite found in the area and an historical magnetic
geophysical survey by the Geological Survey of Mexico showed no magnetic
anomaly. There are a few potential explanations for the anomaly of this
size from mines in Zacatecas. At the Real de Angeles mine and the mine
at Fresnillo there were large stockwork vein systems. Previous drilling
at Tabasquena has found a near surface network of epithermal veins with
widespread gold and silver mineralization, although the IP survey did
not pick up that network of drilled veins. Another possibility is a
porphyry intrusion that are known to be below epithermal vein systems.
Finally, volcanogenic massive sulphide deposits (VMS) are known to occur
in clusters, so far, there is only one found in the area, Teck’s San
Nicolas VMS deposit. The San Nicolas discovery was found with the first
drill hole into a large IP chargeability anomaly. For a small company
like Advance Gold to have such a significant anomaly, in a prolific
region for mines is exceptional, now we are drilling to better
understand what we have at the Tabasquena project.”
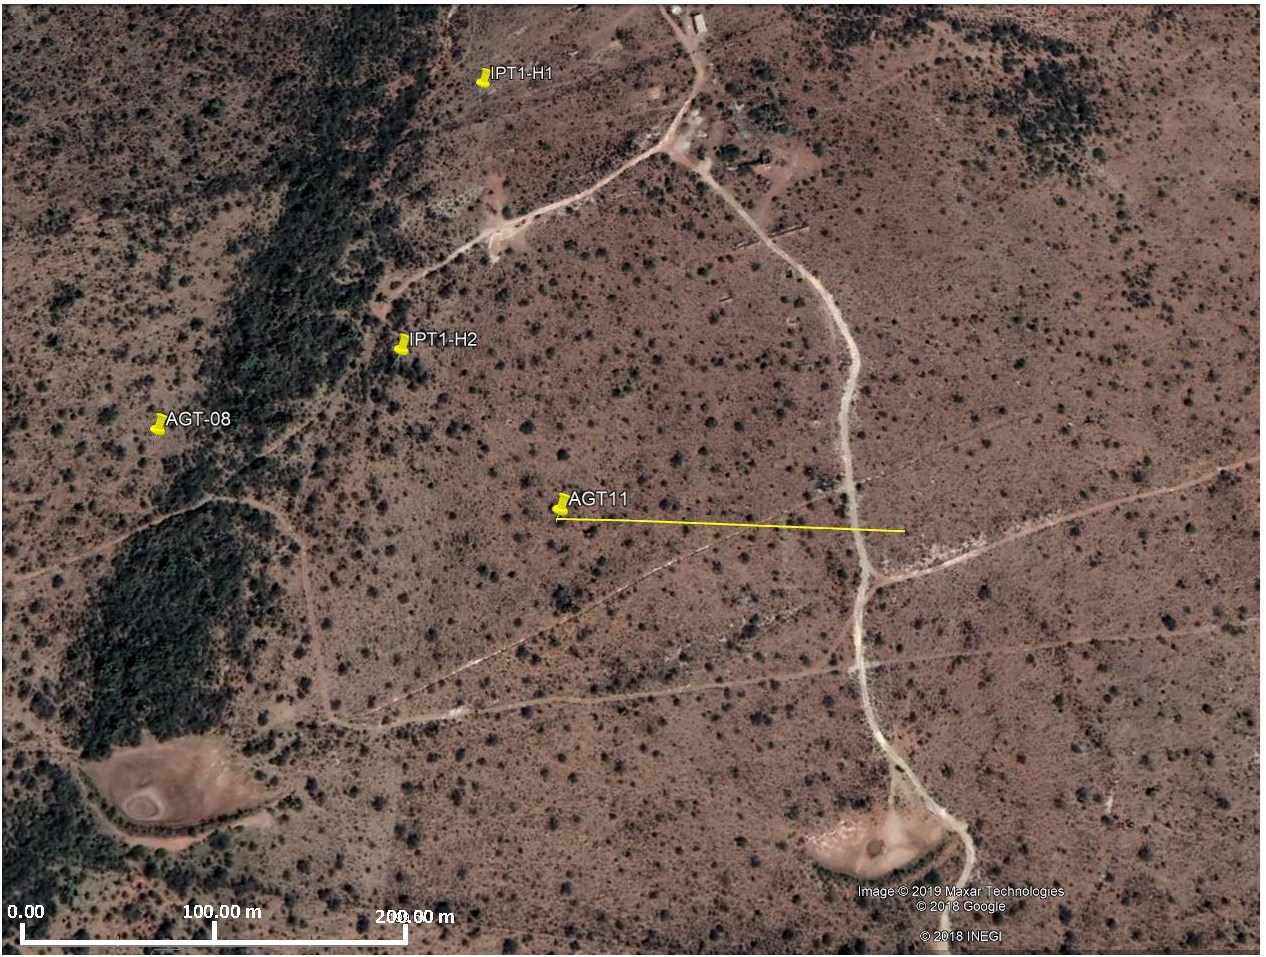
The
first drill hole to test the chargeability anomaly will be
approximately in the middle of the anomaly. It will be drilled at a 65
degree angle, from west to east. The first image below shows the collar
location and direction of the hole. In the north part of the image, you
can see the Tabasquena shaft area, where historical mining was done in
the oxide zone of the Tabasquena vein, and just off the image to the
south is the Tesorito shaft also used historically to mine the
Tabasquena vein in the oxides.
The
image below is a plan view, with past drill holes outside the purple
area which is the projected chargeability anomaly to surface. Those
drill holes intersected a series of veins, with widespread gold and
silver mineralization. None of the holes reached the chargeability
anomaly.
The
final image below, is a cross section of the new drill hole, which has
been designed to cover approximately 100 metres from west to east, plus
go down to 500 metres and hit the middle of the chargeability anomaly.
The anomaly remains open at depth beyond the planned 500 metres and a
decision will be made during drilling to extend it.
Julio
Pinto Linares is a QP, Doctor in Geological Sciences with specialty in
Economic Geology and Qualified Professional No. 01365 by MMSA., and QP
for Advance Gold and is the qualified person as defined by National
Instrument 43-101 and he has read and approved the accuracy of technical
information contained in this news release.
About Advance Gold Corp. (TSXV: AAX)
Advance
Gold is a TSX-V listed junior exploration company focused on acquiring
and exploring mineral properties containing precious metals. The Company
acquired a 100% interest in the Tabasquena Silver Mine in Zacatecas,
Mexico in 2017, and the Venaditas project, also in Zacatecas state, in
April, 2018.
The
Tabasquena project is located near the Milagros silver mine near the
city of Ojocaliente, Mexico. Benefits at Tabasquena include road access
to the claims, power to the claims, a 100-metre underground shaft and
underground workings, plus it is a fully permitted mine.
Venaditas
is well located adjacent to Teck’s San Nicolas mine, a VMS deposit, and
it is approximately 11km to the east of the Tabasquena project, along a
paved road.
In
addition, Advance Gold holds a 13.23% interest on strategic claims in
the Liranda Corridor in Kenya, East Africa. The remaining 86.77% of the
Kakamega project is held by Barrick Gold Corporation.
For further information, please contact:
Allan Barry Laboucan, President and CEO Phone: (604) 505-4753 Email: [email protected]Reply
Posted by AGORACOM
at 3:21 PM on Tuesday, November 26th, 2019
SPONSOR: Advance Gold AAX.v – Advance Gold controls 100% interest in the Tabasquena Silver Mine in Zacatecas, Mexico. A cluster of 30 Epithermal veins have been discovered, with recent emphasis on exploring a large anomaly to drill. Advance also owns 13.5% of the Kakamega JV attached to Barrick Takeover Offer for Acacia Mining. Click Here For More Info
Gold mining stocks have soared approximately 30% so far in 2019, based on the performance of the NYSE Arca Gold Miners Index (GDM) as of November 15.1 Over the last 12 months, the sector is up nearly 50%. Some investors may assume that gold stocks have run their course. On the contrary, we think that the gold mining equities still have a great deal of upside to offer.
In brief, we think we’re in the early stages of a prolonged bull market for gold. While the relationship between the prices for gold bullion and gold stocks isn’t a linear one, rising demand for the yellow metal commodity has historically driven stock performance. Moreover, despite the recent rally, gold mining stocks have yet to recover from the beating they suffered starting in 2011. Still, recent outperformance — coupled with improving fundamentals — creates momentum, a key factor in many quantitative strategies.
Gold has been a store of value since the beginning of civilization, and yet the nuances of investing in gold — be it the metal or miners — is still a source of confusion. As we see it, that also means opportunity.
Here are five reasons to consider investing in gold equities now.
REASON #1. Rising Gold Prices Drive Demand
Figure 1. Gold Bull Market is Just Getting Started
Source: Bloomberg as of 11/15/19. Gold was $1,514 on 11/1/19, and $1,468 as of 11/15/19.
Gold recently broke past $1,500 an ounce for the first time since 2013 (Figure 1), as global political and macroeconomic trends are driving demand for the yellow metal. Along with other strategists, we think gold bullion could surpass its all-time high of $1,900 within the next couple of years. Key factors driving long-term demand for gold as a store of value and defensive asset, especially among central banks and institutions, include low-to-negative interest rates, rising debt levels, trade tensions and intensifying geopolitical risk.
Price movements for physical gold and gold-mining stocks aren’t perfectly in sync, but the relationship between them is strong and persistent, across economic cycles.
Historically, rising (and falling) gold prices have a three-times multiplier effect on gold stocks: If the value of gold bullion increases by 10%, mining stocks tend to increase by 30%, and vice versa. The reason: Miners have significant fixed operating costs and high operating leverage, meaning big swings in physical gold prices have a larger impact on miners’ profitability.
This relationship cuts both ways, as we saw after physical gold prices peaked in late 2011. As the value of gold subsequently declined (Figure 2), the value of gold stocks plummeted even more. Between 2011 and 2018, the sector posted negative returns in six out of eight calendar years. Even with recent gains, gold mining stocks have yet to recover relative to historical valuations. Since the sector peak in April 2011, gold mining equities are still off by more than 60%.
Figure 2. Gold Mining Equities are Very Undervalued
Source: Bloomberg as of 11/12/19.
Figure 3. Gold Demand Has Rebounded: Purchases by Central Banks
Central banks have been net buyers of gold over the past 10 years. Gold plays an important part in central banks’ reserves management, and they are significant holders of gold. According to the World Gold Council: “Today, central banks own almost 34,000 tonnes (t) of gold, making it the third-largest reserve asset in the world. The increase in central bank demand for gold reflects current geopolitical, political and economic conditions, as well as structural changes in the global economy. Gold is both a liquid, counter-cyclical asset and a long-term store of value. As such, it can help central banks meet their core objectives of safety, liquidity and return.â€
Source: Metals Focus, Refinitiv GFMS, World Gold Council. As of June 30, 2019.
REASON #2. Gold Stocks are Severely Undervalued
Given the amplified volatility of gold stocks relative to gold, investors need to go in with their eyes wide open. Nevertheless, multi-year declines may now set the stage for significant upside.
While miners as a group still trade below their net asset values, the discounts of smaller, “junior†miners are especially extreme, as much of the recent rally has been driven by the largest, “senior†gold miners. In fact, the valuation gap between North American junior and senior gold miners is the widest it’s ever been.
Figure 4. The Valuation Gap Between Senior and Juniors is at Historic Extremes
Source: BMO Capital Markets, FactSet. North American senior vs. junior gold miners. As of 7/19/19.
Reason #3. Supplies are Limited
Most investors grasp the importance of investing in companies whose business models are protected by “competitive moats.†Gold miners have this in spades, as it can take 15 years from discovery of a new gold mine to successful ore production. The barriers to entry are enormous for newcomers in this sector, given the need for expensive and specialized equipment, environmental regulations and political considerations.
Meanwhile, the supply of gold is finite and there have been increasingly fewer gold discoveries in recent years. This dynamic — combined with depressed valuations of junior gold miners — is driving consolidation in the industry. It is far cheaper for senior miners to buy new gold production than to “build†capacity themselves. In fact, based on an analysis of recent transactions, there is a 35% discount for buying ounces in the market via acquisitions versus discovering new ounces (according to Scotiabank).
Figure 5. Major Gold Discoveries have Declined Significantly
Investors love momentum — following positive trends in prices, earnings and other factors — and the rise of quantitative strategies has made this market phenomenon even more pervasive. For the last eight years, momentum has largely worked against the gold mining sector, but now there are signs the wind is shifting, and that momentum could soon work in its favor.
Analysts covering the sector have understandably been conservative in their estimates and may soon be playing catch up, given higher gold prices and a leveling off of mining costs. Any improvements in earnings outlooks could potentially accelerate positive momentum for the sector. As my colleague Paul Wong wrote earlier this month in The Sweet Spot for Gold Equities: â€At this stage in the gold cycle, we are in the sweet spot for gold mining company earnings. A starting low gold price base will result in earnings changes with a high percentage increase when measured quarter-over-quarter or year-over-year.â€
In Figure 6, we highlight the progression of 2020E EPS (estimates of earnings-per-share) revisions for the top-10 gold mining companies in SGDM2 versus the average 2020E EPS for the top-20 companies in the S&P 500 Index.3 Since January 2019, the average 2020E EPS for the top-10 gold mining companies had increased from $0.65 to $0.98 by the end of October, representing a 50% jump, compared to a decline of 9% for the S&P 500. After the Q3 reporting season, we would expect that 2020E EPS for gold miners will be revised even higher.
Figure 6. Sweet Spot for Gold Mining Company Earnings
Source: Bloomberg as of 10/31/19.
REASON #5. Gold Stocks Play a Different Role than Bullion
As with any investment, it’s important to think about the role of gold stocks in the context of a broader portfolio. One common misconception is that gold stocks and physical gold are two sides of the same coin. While their fates are certainly correlated, as asset classes they could not be more different.
Physical gold, whether it’s in the form of coin, bar or a trust (for example, Sprott Physical Gold Trust, NYSE Arca: PHYS), should be viewed as a stable store of value. It’s counter-cyclical and has proven over millennia to be an effective hedge against market turbulence and volatility.
As such, we recommend that investors allocate between 5% to 10% of their assets to physical gold and precious metals.
Gold stocks, conversely, should be viewed in the context of an investor’s overall equity portfolio; the size of the allocation will depend on many factors, including risk tolerance. Strategists advocate owning gold stocks continuously, in part because they have low correlations to the broader market. However, most investors view gold stocks as tactical investments. When valuations are severely depressed, as they are now, gold stocks may have the potential to outperform.
At Sprott, we believe that it may be time to consider investing in gold stocks, in addition to physical gold.
Posted by AGORACOM
at 10:56 AM on Monday, November 25th, 2019
Sponsor: Affinity Metals is a Canadian mineral exploration company building a strong portfolio of mineral projects in North America. The Corporation’s flagship property is the Drill ready Regal Property near Revelstoke, BC. Recent sampling encountered bonanza grade silver, zinc, and lead with many samples reaching assay over-limits. Further assaying of over-limits has been initiated, results will be reported once received. (TSX-V: AFF) Click Here for More Info
Gold mining stocks have soared approximately 30% so far in 2019, based on the performance of the NYSE Arca Gold Miners Index (GDM) as of November 15.1
Over the last 12 months, the sector is up nearly 50%. Some investors
may assume that gold stocks have run their course. On the contrary, we
think that the gold mining equities still have a great deal of upside to
offer.
In brief, we think we’re in the early stages of a prolonged bull
market for gold. While the relationship between the prices for gold
bullion and gold stocks isn’t a linear one, rising demand for the yellow
metal commodity has historically driven stock performance. Moreover,
despite the recent rally, gold mining stocks have yet to recover from
the beating they suffered starting in 2011. Still, recent outperformance
— coupled with improving fundamentals — creates momentum, a key factor
in many quantitative strategies.
Gold has been a store of value since the beginning of civilization,
and yet the nuances of investing in gold — be it the metal or miners — is still a source of confusion. As we see it, that also means opportunity.
Here are five reasons to consider investing in gold equities now.
REASON #1. Rising Gold Prices Drive Demand
Figure 1. Gold Bull Market is Just Getting Started
Source: Bloomberg as of 11/15/19. Gold was $1,514 on 11/1/19, and $1,468 as of 11/15/19.
Gold recently broke past $1,500 an ounce for the first time since
2013 (Figure 1), as global political and macroeconomic trends are
driving demand for the yellow metal. Along with other strategists, we
think gold bullion could surpass its all-time high of $1,900 within the
next couple of years. Key factors driving long-term demand for gold as a
store of value and defensive asset, especially among central banks and
institutions, include low-to-negative interest rates, rising debt
levels, trade tensions and intensifying geopolitical risk.
Price movements for physical gold and gold-mining stocks aren’t
perfectly in sync, but the relationship between them is strong and
persistent, across economic cycles.
Historically, rising (and falling) gold prices have a three-times
multiplier effect on gold stocks: If the value of gold bullion increases
by 10%, mining stocks tend to increase by 30%, and vice versa. The
reason: Miners have significant fixed operating costs and high operating
leverage, meaning big swings in physical gold prices have a larger
impact on miners’ profitability.
This relationship cuts both ways, as we saw after physical gold
prices peaked in late 2011. As the value of gold subsequently declined
(Figure 2), the value of gold stocks plummeted even more. Between 2011
and 2018, the sector posted negative returns in six out of eight
calendar years. Even with recent gains, gold mining stocks have yet to
recover relative to historical valuations. Since the sector peak in
April 2011, gold mining equities are still off by more than 60%.
Figure 2. Gold Mining Equities are Very Undervalued
Source: Bloomberg as of 11/12/19.
Figure 3. Gold Demand Has Rebounded: Purchases by Central Banks
Central banks have been net buyers of gold over the past 10 years. Gold plays an important part in central banks’ reserves management, and they are significant holders of gold. According to the World Gold Council:
“Today, central banks own almost 34,000 tonnes (t) of gold, making it
the third-largest reserve asset in the world. The increase in central
bank demand for gold reflects current geopolitical, political and
economic conditions, as well as structural changes in the global
economy. Gold is both a liquid, counter-cyclical asset and a long-term
store of value. As such, it can help central banks meet their core
objectives of safety, liquidity and return.”
Source: Metals Focus, Refinitiv GFMS, World Gold Council. As of June 30, 2019.
REASON #2. Gold Stocks are Severely Undervalued
Given the amplified volatility of gold stocks relative to gold,
investors need to go in with their eyes wide open. Nevertheless,
multi-year declines may now set the stage for significant upside.
While miners as a group still trade below their net asset values, the
discounts of smaller, “junior†miners are especially extreme, as much
of the recent rally has been driven by the largest, “senior†gold
miners. In fact, the valuation gap between North American junior and
senior gold miners is the widest it’s ever been.
Figure 4. The Valuation Gap Between Senior and Juniors is at Historic Extremes
Source: BMO Capital Markets, FactSet. North American senior vs. junior gold miners. As of 7/19/19.
Reason #3. Supplies are Limited
Most investors grasp the importance of investing in companies whose
business models are protected by “competitive moats.†Gold miners have
this in spades, as it can take 15 years from discovery of a new gold
mine to successful ore production. The barriers to entry are enormous
for newcomers in this sector, given the need for expensive and
specialized equipment, environmental regulations and political
considerations.
Meanwhile, the supply of gold is finite and there have been
increasingly fewer gold discoveries in recent years. This dynamic —
combined with depressed valuations of junior gold miners — is driving
consolidation in the industry. It is far cheaper for senior miners to
buy new gold production than to “build†capacity themselves. In fact,
based on an analysis of recent transactions, there is a 35% discount for
buying ounces in the market via acquisitions versus discovering new
ounces (according to Scotiabank).
Figure 5. Major Gold Discoveries have Declined Significantly
Investors love momentum — following positive trends in prices,
earnings and other factors — and the rise of quantitative strategies has
made this market phenomenon even more pervasive. For the last eight
years, momentum has largely worked against the gold mining sector, but
now there are signs the wind is shifting, and that momentum could soon
work in its favor.
Analysts covering the sector have understandably been conservative in
their estimates and may soon be playing catch up, given higher gold
prices and a leveling off of mining costs. Any improvements in earnings
outlooks could potentially accelerate positive momentum for the sector.
As my colleague Paul Wong wrote earlier this month in The Sweet Spot for Gold Equities:
â€At this stage in the gold cycle, we are in the sweet spot for gold
mining company earnings. A starting low gold price base will result in
earnings changes with a high percentage increase when measured
quarter-over-quarter or year-over-year.â€
In Figure 6, we highlight the progression of 2020E EPS (estimates of
earnings-per-share) revisions for the top-10 gold mining companies in
SGDM2 versus the average 2020E EPS for the top-20 companies in the S&P 500 Index.3
Since January 2019, the average 2020E EPS for the top-10 gold mining
companies had increased from $0.65 to $0.98 by the end of October,
representing a 50% jump, compared to a decline of 9% for the S&P
500. After the Q3 reporting season, we would expect that 2020E EPS for
gold miners will be revised even higher.
Figure 6. Sweet Spot for Gold Mining Company Earnings
Source: Bloomberg as of 10/31/19.
REASON #5. Gold Stocks Play a Different Role than Bullion
As with any investment, it’s important to think about the role of
gold stocks in the context of a broader portfolio. One common
misconception is that gold stocks and physical gold are two sides of the
same coin. While their fates are certainly correlated, as asset classes
they could not be more different.
Physical gold, whether it’s in the form of coin, bar or a trust (for example, Sprott Physical Gold Trust,
NYSE Arca: PHYS), should be viewed as a stable store of value. It’s
counter-cyclical and has proven over millennia to be an effective hedge
against market turbulence and volatility.
As such, we recommend that investors allocate between 5% to 10% of their assets to physical gold and precious metals.
Gold stocks, conversely, should be viewed in the context of an
investor’s overall equity portfolio; the size of the allocation will
depend on many factors, including risk tolerance. Strategists advocate
owning gold stocks continuously, in part because they have low
correlations to the broader market. However, most investors view gold
stocks as tactical investments. When valuations are severely depressed,
as they are now, gold stocks may have the potential to outperform.
At Sprott, we believe that it may be time to consider investing in gold stocks, in addition to physical gold.
Posted by AGORACOM
at 9:06 AM on Friday, November 22nd, 2019
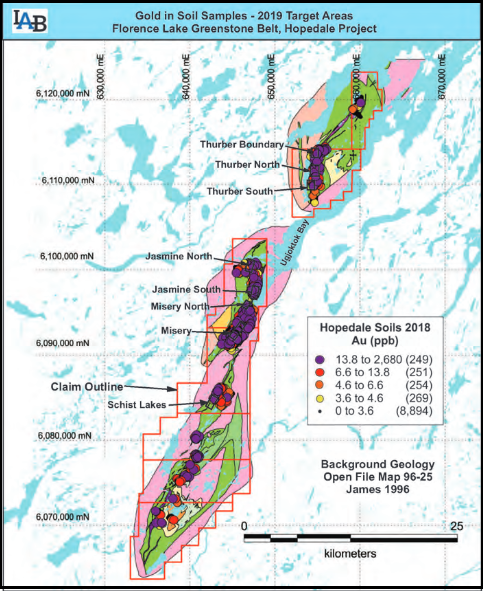
Selected grab samples from new gold showing north of the Thurber Dog gold occurrence show assays between 1.67 and 8.26 g/t Au
Extends potential strike length of gold mineralization by approximately 500 metres along strike to the north
Occurs
within a larger 3km trend of anomalous gold in rock and soil associated
with the contact between mafic/ultramafic volcanic rocks and felsic
volcanic rocks
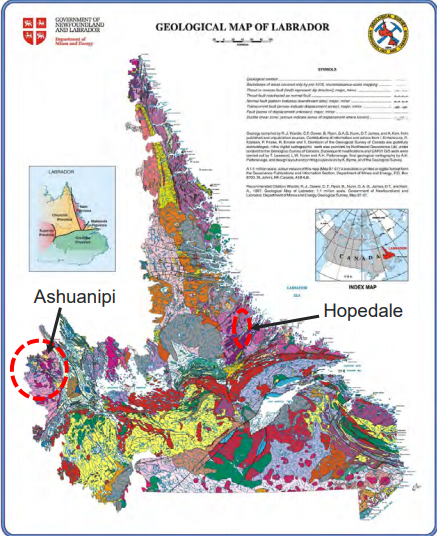
Labrador
Gold Corp. (TSX-V: LAB) (“Labrador Gold†or the “Companyâ€) is pleased
to announce results of rock sampling at its Hopedale project in
Labrador.
The
Company controls a 57-kilometre strike length of stratigraphy
prospective for gold in the Florence Lake Greenstone Belt (FLGB). To
date, the Company has defined eight high potential areas for gold within
the belt. The 2019 exploration program was designed to generate drill
targets within these areas using detailed geological mapping, rock
sampling and prospecting and ground magnetics/VLF-EM (very low frequency
electromagnetics).
Sampling
of the prospective areas resulted in 201 rock samples with gold values
ranging from below the detection limit of 5 parts per billion (ppb) to
8.26 grams per tonne (g/t) in selected grab samples. The highest gold
values were from three samples taken at the site of a new mineralized
showing discovered shortly after the start of field work (see News
Release dated July 26, 2019). The showing is located approximately 500
metres north, and along strike of, the Thurber Dog gold occurrence where
previous Labrador Gold rock sampling returned values up to 7.87 g/t Au.
Mineralization is comprised of disseminated to semi-massive pyrite and
arsenopyrite hosted by felsic metavolcanic rocks with pervasive iron
oxide alteration. The three samples from the occurrence assayed 1.67 g/t
Au, 2.83 g/t Au and 8.26 g/t Au.
Anomalous
gold values were also found in samples from elsewhere in the targeted
areas and range from 0.11 g/t Au to 0.6 g/t Au (See table below). To
date the company has collected 12,510 soil samples, 414 lake sediment
samples and 834 rock samples along the length of the greenstone belt.
“Our
systematic approach to exploration of the Florence Lake belt continues
to turn up anomalous gold values in areas of high potential.†said Roger
Moss, President and Chief Executive Officer of Labrador Gold. “The
Thurber Dog area stands out as the most consistently mineralized gold
trend in the belt and we are still finding gold mineralization that
fills in gaps along the three kilometre stretch of anomalous gold in
both rock and soil. The discovery of the new gold showing this season is
the latest addition to what is turning into a prolific trend.â€
Highlights of 2019 rock sample assays.
Sample ID
Easting
Northing
Sample Type*
Rock type
Mineralization
Au (ppb)
Area
1702676
654781
6110696
Grab
Quartz vein
Py, Apy
8,263
New Showing
1710148
654778
6110691
Grab
Felsic volcanic
Py, Apy
1.672
New Showing
1710149
654781
6110696
Grab
Felsic volcanic
Py, Apy
2.831
New Showing
1710140
654745
6111249
Grab
Chlorite schist
–
602
Thurber Trend
1695444
654628
6112280
Grab
Ultramafic volcanic
Py
114
Thurber North
1995433
654628
6112280
Grab
Quartz vein
Py
224
Thurber North
1705230
654996
6113663
Grab
Mafic volcanic
Apy
532
Thurber Boundary
1691224
647639
6100795
Grab
Ultramafic volcanic
Apy, Py
107
Jasmine North
1702687
648021
6098550
Grab
Iron formation
Py
388
Jasmine South
1705738
647074
6095318
Grab
Quartz vein
–
134
Misery North
1702678
644914
6091661
Grab
Quartz vein
Py
488
Misery
1785270
643338
6085835
Grab
Mafic volcanic
Py
336
Schist Lakes
*Note that grab samples are select samples and are not necessarily
representative of gold mineralization found on the property.
Abbreviations: Py pyrite; Apy Arsenopyrite.
All samples were shipped to the Bureau Veritas laboratory in
Vancouver, BC, where they were crushed and split and a 500g sub sample
pulverized to 200 mesh. Samples of 30g were analyzed for gold by fire
assay with an atomic absorption finish and another 15g sample for 36
elements by ultratrace ICP-MS (inductively coupled plasma-mass
spectrometry) following an aqua regia digestion. Over limit samples
(greater than 10g/t Au) are re-assayed using fire assay with a
gravimetric finish. In addition to the QA-QC conducted by the
laboratory, the Company routinely submits blanks, field duplicates and
certified reference standards with batches of samples to monitor the
quality of the analyses.
Roger Moss, PhD., P.Geo., is the qualified person responsible for all technical information in this release.
About Labrador Gold:
Labrador Gold is a Canadian based mineral exploration company focused
on the acquisition and exploration of prospective gold projects in the
Americas. In 2017 Labrador Gold signed a Letter of Intent under which
the Company has the option to acquire 100% of the 896 square kilometre
(km2) Ashuanipi property in northwest Labrador and the Hopedale (458
km2) property in eastern Labrador.
The Hopedale property covers much of the Hunt River and Florence Lake
greenstone belts that stretch over 80 km. The belts are typical of
greenstone belts around the world but have been underexplored by
comparison. Initial work by Labrador Gold during 2017 show gold
anomalies in soils and lake sediments over a 3 kilometre section of the
northern portion of the Florence Lake greenstone belt in the vicinity of
the known Thurber Dog gold showing where grab samples assayed up to
7.8g/t gold. In addition, anomalous gold in soil and lake sediment
samples occur over approximately 40 kilometres along the southern
section of the greenstone belt (see news release dated January 25th 2018
for more details). Labrador Gold now controls approximately 57km strike
length of the Florence Lake Greenstone Belt.
The Ashuanipi gold project is located just 35 km from the historical
iron ore mining community of Schefferville, which is linked by rail to
the port of Sept Iles, Quebec in the south. The claim blocks cover large
lake sediment gold anomalies that, with the exception of local
prospecting, have not seen a systematic modern day exploration program.
Results of the 2017 reconnaissance exploration program following up the
lake sediment anomalies show gold anomalies in soils and lake sediments
over a 15 kilometre long by 2 to 6 kilometre wide north-south trend and
over a 14 kilometre long by 2 to 4 kilometre wide east-west trend. The
anomalies appear to be broadly associated with magnetic highs and do not
show any correlation with specific rock types on a regional scale (see
news release dated January 18th 2018). This suggests a possible
structural control on the localization of the gold anomalies. Historical
work 30 km north on the Quebec side led to gold intersections of up to
2.23 grams per tonne (g/t) Au over 19.55 metres (not true width)
(Source: IOS Services Geoscientifiques, 2012, Exploration and geological
reconnaissance work in the Goodwood River Area, Sheffor Project, Summer
Field Season 2011). Gold in both areas appears to be associated with
similar rock types.
The Company has 57,039,022 common shares issued and outstanding and trades on the TSX Venture Exchange under the symbol LAB.
Posted by AGORACOM
at 10:48 AM on Wednesday, November 20th, 2019
Labrador Gold is aggressively pursuing the under explored gold potential of Labrador.
2 large, separate, under-explored land packages that demonstrate potential for district scale gold discoveries.
Two successful gold explorers lead the way in the Labrador gold rush: Shawn Ryan and Roger Moss.
2 Key Exploration Properties: Hopedale and Ashuanipi
Hopedale:
The Hopedale property covers much of the Hunt River and Florence Lake
greenstone belts that stretch over 80 km. The belts are typical of
greenstone belts around the world but have been underexplored by
comparison. Initial work by Labrador Gold during 2017 show gold
anomalies in soils and lake sediments over a 3 kilometre section of the
northern portion of the Florence Lake greenstone belt in the vicinity of
the known Thurber Dog gold showing where grab samples assayed up to
7.8g/t gold. In addition, anomalous gold in soil and lake sediment
samples occur over approximately 40 kilometres along the southern
section of the greenstone belt (see news release dated January 25th 2018
for more details). Labrador Gold now controls approximately 57km strike
length of the Florence Lake Greenstone Belt.
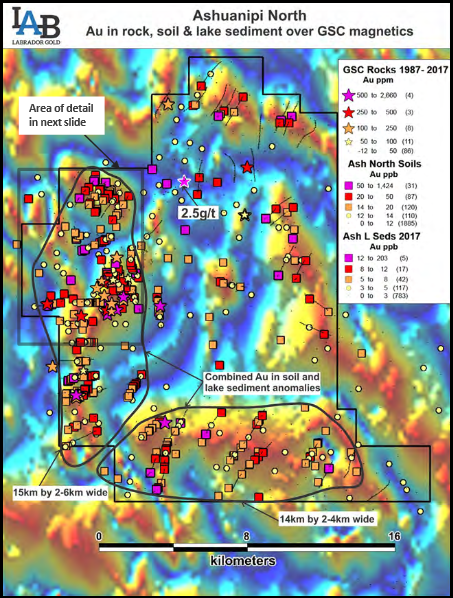
Ashuanipi:
Two district scale gold anomalies outlined by soil and lake sediment survey: 15x3km north south anomaly and a 14 x 3km east west anomaly
2018 Soil Sampling identified: 164 samples with over 50 ppb gold, 67 samples over 100 ppb (0.1g/t) gold and a high of 8,973 ppb (8.97 g/t) Au
The Ashuanipi gold project is located just
35 km from the historical iron ore mining community of Schefferville,
which is linked by rail to the port of Sept Iles, Quebec in the south.
The claim blocks cover large lake sediment gold anomalies that, with the
exception of local prospecting, have not seen a systematic modern day
exploration program. Results of the 2017 reconnaissance exploration
program following up the lake sediment anomalies show gold anomalies in
soils and lake sediments over a 15 kilometre long by 2 to 6 kilometre
wide north-south trend and over a 14 kilometre long by 2 to 4 kilometre
wide east-west trend. The anomalies appear to be broadly associated with
magnetic highs and do not show any correlation with specific rock types
on a regional scale (see news release dated January 18th 2018). This
suggests a possible structural control on the localization of the gold
anomalies.
Posted by AGORACOM
at 12:15 PM on Monday, November 18th, 2019
Has now completed the drilling portion of the 2019 Regal exploration
program at the Regal property, 1,846 meters of diamond drilling was
completed in 21 holes.
22 samples collected from the Black Jacket and Allco areas of the
Regal property located approximately 35 km northeast of Revelstoke, BC.
The majority contained bonanza grade silver, zinc, and lead with many samples reaching assay over-limits.
Further assaying of over-limits has been initiated, results will be reported once received.
Property History & Background
The property hosts numerous mineral occurrences including the following past-producing mines:
Snowflake and Regal Silver (Stannex/Woolsey) Mines
The Snowflake and Regal Silver mines were two former producing mines
that operated intermittently during the period 1936-1953. The last
significant work on the property took place from 1967-1970, when Stannex
Minerals completed 2,450 meters of underground development work and a
feasibility study, but did not restart mining operations. In 1982,
reported reserves were 590,703 tonnes grading 71.6 grams per tonne
silver, 2.66 per cent lead, 1.26 per cent zinc, 1.1 per cent copper,
0.13 per cent tin and 0.015 per cent tungsten (Minfile No. 082N 004 –
Prospectus, Gunsteel Resources Inc., April 29, 1986). It should be noted
that the above resource and grades, although believed to be reliable,
were prepared prior to the adoption of NI43-101 and are not compliant
with current standards set out therein for calculating mineral resources
or reserves.
ALLCO Silver Mine
The Allco Silver Mine is situated 6.35 Kilometers northwest of the
above described Snowflake/Regal Mine(s) and is also part of the Affinity
claim group.
The Allco Silver Mine operated from 1936-1937 and produced 213 tonnes
of concentrates containing 11 troy ounces of gold (1.55 g/t), 11,211
troy ounces of silver (1,637 g/t) and 173,159 lbs of lead (36.9%).
Airborne Geophysics to Guide Future Exploration
An extensive airborne geophysics survey conducted by Geotech Ltd of
Aurora, Ontario, for Northaven Resources Corp. in 2011, identified four
well defined high potential linear targets correlating with the same
structural orientation as the Allco, Snowflake and Regal Silver mines.
Northaven also reported that the mineralogy and structural orientation
of the Allco, Snowflake and Regal Silver appeared to be similar to that
of Huakan’s J&L gold project located to the north, and on a similar
geophysical trend line. The J&L is reportedly now one of western
Canada’s largest undeveloped gold mineral resources.
After completing the airborne survey, Northaven failed in financing
their company and conducting further exploration on the property and
subsequently forfeited the claims without any of the follow up work ever
being completed. Affinity Metals is in the fortunate position of
benefitting from this significant and promising geophysics data and
associated targets.
The aforementioned Northaven airborne geophysical survey conducted at
a cost of $319,458.95 in August of 2011 is described in The BC Ministry
of Energy, Mines and Petroleum Resources Assessment Report #33054. The
results of the survey are competently explained and illustrated by
professionals on You Tube at: https://www.youtube.com/watch?v=GX431eBY_t0
FULL DISCLOSURE: Affinity Metals is an advertising client of AGORA Internet Relations Corp
Posted by AGORACOM
at 11:28 AM on Monday, November 18th, 2019
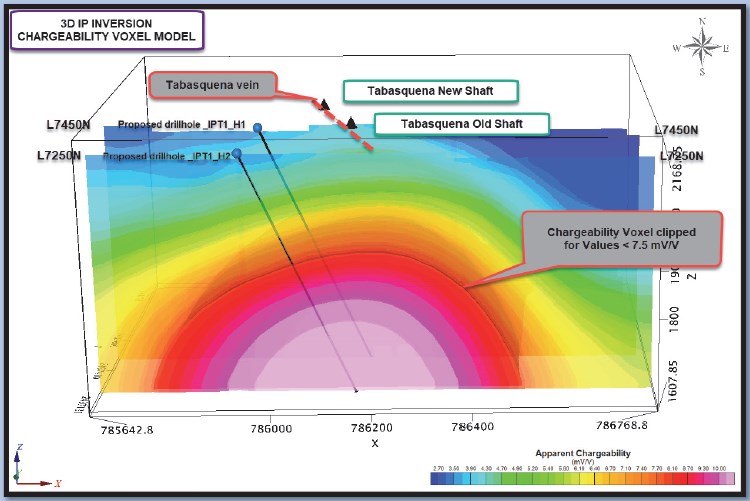
A 3D Induced Polarization (IP) geophysical survey on its Tabasquena project in Zacatecas, Mexico has outlined a significant continuous chargeability anomaly.
This anomaly now has an east-west width of approximately 400 to 500 metres and an apparent strike length of over 1000 metres.
The anomaly remains open to the north and to the south and at depth.
Drilling to commence once the IP survey has been completed.
The
chargeability anomaly is approximately 250 metres below historical
mining and was designed for 500 to 550 metres of vertical depth
investigation.
The IP data also clearly shows that the large polarisable body/target
is apparently quickly deepening northward and getting closer to surface
southward. The IP anomaly starts at around 100 metres below the past
drill hole intersections that contained widespread gold and silver
mineralization in epithermal veins.
Tabasquena
Previous drilling found a network of veins with widespread gold and silver mineralization.
The
first phase geophysical survey revealed a large chargeability anomaly
right below these veins and is getting nearer to the surface as it
trends south.
Geophysical advisor described the anomaly as ‘quite remarkable in its size and continuity.
Advance is in a region with very large mines, including the El Coronel open pit, 12 miles to the south of Tabasquena.
Posted by AGORACOM
at 11:47 AM on Thursday, November 14th, 2019
23 holes drilled in the last two years have intersected significant mineralization and dramatically increased the size of the Goldstorm deposit at Treaty Creek
Eric Sprott re-emphasized the potential of the project in a podcast where he stated that he is “hoping they can prove up a 20-million-ounce depositâ€
11:30 –“I still believe there’s going to be huge deposit proven
up there. If we get the right environment in precious metals, which it
looks like we might be getting here, people are going to start looking
at these things again, and it could be very, very exciting, so…and I am,
kind of, hoping that they can ultimately pull up, like, a 20 million
ounce deposit there. So these stocks would prove to be very, very
inexpensiveâ€
SUMMARIZING THE 2019 PROGRAM
The Company’s JV partner, Tudor Gold’s 2019 exploration program at
the Goldstorm Zone on Treaty Creek totalled 9,781.8 meters with 14
diamond drill holes. This year’s drilling program generated the best
near-surface results attained to date on the project. Specifically, in
addition to several hundred meters extension along strike to the
northeast, the 2019 program significantly expanded the mineralized
limits to the southeast, where one of the best near-surface intervals
averaged 2 g/t Au over 87m, within 336 m averaging 1 g/t Au in hole GS19-52.
RESULTS OF THE FINAL 5 DRILL HOLES
Hole GS19-49 was drilled to 960.1 m, at -80° dip, on Section
111+00 NE next to the previously announced vertical hole GS19-48, which
yielded 0.725 g/t Auover 838.5m, including an upper horizon that averaged 1.048 g/t gold Au over 328.5 m. Hole GS19-49 returned equally impressive results with a comparable 0.7 g/t Au over 826.5 m and the upper horizon averaging 1 g/t Au over 249 m
Along
the same section, hole GS19-52 (-50° dip at 115° azimuth) was drilled
much longer than expected because the Goldstorm System continues at
least 700 m to the southeast ; GS19-52 averaged 1 g/t gold over 336 meters with a higher grade core of 2 g/t gold over 87 meters within the upper horizon.
Tudor Gold Exploration Manager, Ken Konkin explained:
“Clearly the results of the previously reported deep vertical step-out
holes demonstrate the impressive size and grade consistency of the
Goldstorm system. Within the overall mineralized package of fragmental
intermediate volcanic rocks there are several sub-horizontal horizons of
significantly higher gold grades. The uppermost portions of the
previously reported holes GS19-42, GS19-47 and GS19-48 contained
respectively, 1.268 g/t gold over 252 m, 0.828 g/t gold over 301.5 m and
1.048 g/t gold over 328.5 m. We now have several other drill holes with excellent near-surface gold values to add to this list of growing intercepts. GS19-52 has returned the highest core gold grades of 2.006 g/t Au over 87 m within a 336m intercept of 1.004 g/t Au.
These
intercepts are part of the uppermost portion of the Goldstorm system
which we refer to as the ‘300 Horizon’. The ‘300 Horizon’ remains open
along strike to the northeast as well as to the southeast. In addition,
the lower horizons of the Goldstorm system also remain open in all
directions and the lowest horizon is open at depth.â€
Furthermore, Mr. Konkin added:
“We are seeing consistent silver and copper mineralization associated
with the deeper gold horizons such as the previously reported 151.5 m zone of 0.572 g/t gold, 8.5 g/t silver and 0.21% copper that was intercepted from 665.0 to 816.5 m in GS19-47 and a 66.0 m zone with 0.958 g/t gold, 3.9 g/t silver and 0.35% copper, whichwas intercepted from 874.5 to 940.5 m in GS19-48. Similarly, we have now seen in GS19-49, a 78 m intercept averaging 1.145 g/t gold, 11.2 g/t silver and 0.21% copper (750-828 m) and in GS19-52 an 88.5 m interval averaging 0.352 g/t gold, 9.3 g/t silver and 0.25% copper (515-603.5
m). Not only does the Goldstorm Zone remain open at depth and along
strike, we are now seeing base-metal associations possibly as part of a
zonation within the hydrothermal system.â€
The final three footwall
extension holes (GS19-50, GS19-51 and GS19-53) were completed on
section 110+00 NE. These were successful in extending the width of the
mineralized zone to the southeast:
Hole GS19-50 returned an average of 0.602 g/t Au over 577.5 m including 0.811 g/t Au over 267.0 m in the ‘300 Horizon‘
Hole GS19-51 returned an average of 0.721 g/t Au over 246 m in the ‘300 Horizon’ and a lower horizon that averages 1.017 g/t Au over 40.5 m.
Hole GS19-53 returned an average of 0.984 g/t Au over 147.0 min the ‘300 Horizon’
About American Creek
American
Creek is a Canadian junior mineral exploration company with a strong
portfolio of gold and silver properties in British Columbia.
Three
of those properties are located in the prolific “Golden Triangleâ€; the
Treaty Creek and Electrum joint venture projects with Tudor Gold/Walter
Storm as well as the 100% owned past producing Dunwell Mine.
The
Treaty Creek Project is a Joint Venture with Tudor Gold owning 60% and
acting as operator. American Creek and Teuton Resources each have 20%
interests in the project. American Creek and Teuton are both fully
carried until such time as a Production Notice is issued, at which time
they are required to contribute their respective 20% share of
development costs. Until such time, Tudor is required to fund all
exploration and development costs while both American Creek and Teuton
have “free ridesâ€.
The
Corporation also holds the Gold Hill, Austruck-Bonanza, Ample Goldmax,
Silver Side, and Glitter King properties located in other prospective
areas of the province.
For further information please contact Kelvin Burton at: Phone: 403 752-4040 or Email: [email protected]. Information relating to the Corporation is available on its website at www.americancreek.com.
Hub on Agoracom FULL DISCLOSURE: American Creek is an advertising client of AGORA Internet Relations Corp.
Posted by AGORACOM
at 1:03 PM on Wednesday, November 6th, 2019
Kamloops,
British Columbia–(Newsfile Corp. – November 6, 2019) – Advance Gold
Corp. (TSXV: AAX) (“Advance Gold” or “the Company”) is pleased to
announce that the recently completed second phase of 3D Induced
Polarization (IP) geophysical survey on its Tabasquena project in
Zacatecas, Mexico, has significantly increased the size of its
continuous chargeability anomaly. This anomaly now has an east-west
width of approximately 400 to 500 metres and an apparent strike length
of over 1000 metres. The anomaly remains open to the north and to the
south and at depth.
Images
below are east-west cross sections representing key portions of the
overall anomaly where upcoming drilling will test this continuous
chargeability anomaly.
Allan Barry Laboucan, President and CEO of Advance Gold Corp. commented: “After
our first phase of geophysics, we identified a large chargeability
anomaly with the highest chargeability at the southern end of the grid
and still wide open. In that southerly direction we have elevation
relief and it was also where the anomaly appeared to be closest to
surface. Prior to drilling this anomaly, we decided to carry out a
second phase of geophysics to see if the anomaly continued to the south.
The second phase of geophysics has revealed that the anomaly actually
has a much longer strike length and appears to be somewhat wider. This
chargeability anomaly is now at least 1000 metres from north to south
and approximately 400 to 500 metres from east to west. It sits below a
network of veins with widespread gold and silver mineralization that
ranges from anomalous to high-grade gold. There are three shafts on the
property that go down around 100 metres that were used in the historical
mining of the oxide zone of the Tabasquena vein. The geophysical
anomaly is primarily right below those shafts, starting at approximately
200 metres below the underground workings. It is fair to say that we
have identified a major target. Our next step will be to drill this
target, we expect to start this shortly and will put out a news release
once it has started.”
Gennen McDowall, Geophysical Advisor to Advance Gold Corp. commented:
“This southerly extension to the original IP grid has shown that the
large chargeability anomaly first detected in August is actually much
bigger than originally thought and appears to strike right across the
claim group and shows little evidence of ending either to the north or
to the south and its depth extent is as of yet unknown. The
chargeability anomaly is visible on every east-west IP line. The
observed near surface mineralisation may be an expression of a much
larger mineralised body underlying the entire Tabasquena project.”
Details of Geophysical Survey
The
first 3D Induced Polarization survey was carried out by GEOFISICA TMC
SA de CV, between August 3rd and August 14th, 2019. Approximately 9.6
kms of IP data was collected over the central portion of the company’s
claims. This was followed up by a second phase of geophysics consisting
of 5 east-west lines. The southerly extent of the second survey reached
just beyond the Tesorito shaft. An off-set pole dipole array was used.
Data
processing and inversion of the data was carried out using RES3DINV
software. The inversion model was extended to approximately 550 metres
below surface. 3D Voxel images together with a series of depth slices
were generated (all available on the company’s website).
The
main purpose of the IP survey was to map, laterally and at depth the
evolution of the known gold and silver veins and to identify any new
mineralised structures. The survey was designed in such a way to allow
approximately 500 to 550 metres of vertical depth investigation.
The
IP survey area encompassed the historic and new shafts that are located
to the east of the Tabasquena and Nina veins that define a mineralised
system that outcrops at surface for 2.0 km. From past exploration work,
the Tabasquena vein was recognized over approximately 70 m along strike
near the shafts but only at shallow depth (< 100 m).
The
fourteen (14) vertical sections that were extracted from the 3D IP
inversion voxels suggest the presence of (4) four main stratigraphic
horizons (lithological units) mainly characterized by their resistivity
signatures.
The
IP data also clearly shows that the large polarisable body/target is
apparently quickly deepening northward and getting closer to surface
southward. The IP anomaly starts at around 100 metres below the past
drill hole intersections that contained widespread gold and silver
mineralization in epithermal veins.
Chargeability
and resistivity anomalies are indicated on the IP sections (see report
on company’s website) and are graded as per their relative strength.
Those chargeability anomalies that are deemed to be caused by the same
anomalous target are grouped together in what is called a polarisable
axis. Only one main axis was delineated following the review of the IP
data, which was labelled IPT-1 (Map C351-3 & Figure 11, report on
company website). This axis is a single large amplitude continuous
chargeability anomaly running north-south, coincident with the two
shafts at Tabasquena, the Tesorito shaft and the surface projection of
the mineralised veins. This anomaly has been categorized as having a
high chargeability and is conductive. The anomaly has an average depth
of approximately 250 to 300 meters. It should also be mentioned that
this anomaly is visible on every line, albeit less intense on the most
northerly line, as the target is becoming deeper to the north.
In conclusion
This
geophysical work has now identified a large consistent chargeability
anomaly that can be seen on all lines, implying a strike extent of at
least 1000 metres and an apparent width of 400 to 500 metres. This
observed IP anomaly could define a much wider mineralised system at
depth.
The
main recommendation of the original geophysical report was that prior
to drilling the anomaly the 3D IP survey should be extended to the
southeast for at least 1 km in the direction of the Tesorito shaft. This
has now been completed and this new work has established that the main
anomaly does in fact continue past the Tesorito shaft and is somewhat
wider. A number of boreholes are now planned to intersect this anomaly.
Julio
Pinto Linares is a QP, Doctor in Geological Sciences with specialty in
Economic Geology and Qualified Professional No. 01365 by MMSA., and QP
for Advance Gold and is the qualified person as defined by National
Instrument 43-101 and he has read and approved the accuracy of technical
information contained in this news release.
About Advance Gold Corp. (TSXV: AAX)
Advance
Gold is a TSX-V listed junior exploration company focused on acquiring
and exploring mineral properties containing precious metals. The Company
acquired a 100% interest in the Tabasquena Silver Mine in Zacatecas,
Mexico in 2017, and the Venaditas project, also in Zacatecas state, in
April, 2018.
The
Tabasquena project is located near the Milagros silver mine near the
city of Ojocaliente, Mexico. Benefits at Tabasquena include road access
to the claims, power to the claims, a 100-metre underground shaft and
underground workings, plus it is a fully permitted mine.
Venaditas
is well located adjacent to Teck’s San Nicolas mine, a VMS deposit, and
it is approximately 11km to the east of the Tabasquena project, along a
paved road.
In
addition, Advance Gold holds a 13.23% interest on strategic claims in
the Liranda Corridor in Kenya, East Africa. The remaining 86.77% of the
Kakamega project is held by Barrick Gold Corporation.
For further information, please contact:
Allan Barry Laboucan, President and CEO Phone: (604) 505-4753 Email: [email protected]