Posted by Brittany McNabb
at 9:12 AM on Wednesday, December 6th, 2023
Introduction:
In the heart of British Columbia’s Cariboo Mining District, Green River Gold Corp. (CSE: CCR) (OTC Pink: CCRRF) is making waves with a groundbreaking announcement that positions the company as a key player in the mining industry. The recently received assay results from the Quesnel Nickel Project mark a significant milestone in Green River’s pursuit of mineral wealth.
Background and Context:
Green River Gold’s journey is rooted in over 50 drill holes, covering almost 10 kilometers along the Deep Purple magnetic anomaly. These holes consistently reveal nickel, magnesium, cobalt, and chromium starting from the surface of the bedrock. The company’s commitment to exploration and resource development has laid a robust foundation for success in the Cariboo Mining District.
Key Highlights and Advantages:
The assay results from drill holes WK-23-06, WK-23-07, and WK-23-08 showcase an average nickel grade of 0.18% and an impressive magnesium grade exceeding 21%. What sets Green River Gold apart is the consistency in results, mirroring those from previous years. The upcoming 6,000-meter NQ drill program and the ongoing exploration signify a strategic push toward development, affirming the company’s commitment to unlocking the potential of the Quesnel Nickel Project.
Potential Impact and Significance:
The Quesnel Nickel Project’s immense upside potential is highlighted by Kyle Townsend, Mine Manager for Green River. The continuous mineralization across all 50 consecutive drill holes underscores the project’s promising prospects. As Green River Gold embarks on a new phase of drilling, the potential impact on the company, the industry, and the broader market is a testament to the strategic importance of this discovery.
Expert Opinions and Analysis:
Experts echo the sentiment of optimism surrounding Green River Gold. Perry Little, President and CEO, emphasizes the significance of Craig Brekkas joining the Board, bringing over 30 years of experience in agriculture markets. His expertise adds a new perspective as the company looks beyond exploration towards development, including the extraction of nickel, talc, and other minerals.
Challenges and Considerations:
While Green River Gold enjoys a wave of success, challenges such as awaiting permits for the 6,000-meter NQ drill program exist. The company’s transparency in addressing challenges and outlining strategies to overcome them reflects a balanced and proactive approach.
Conclusion:
Green River Gold’s assay results reveal more than minerals; they unveil a company poised for prosperity in the mining industry. The consistency in findings, the strategic addition to the Board, and the ambitious drilling program all contribute to a narrative of growth and potential. As Green River Gold continues to carve its path in the Cariboo Mining District, investors and the business community are invited to witness and engage in a journey marked by discovery, innovation, and success.
Posted by Brittany McNabb
at 3:47 PM on Wednesday, November 29th, 2023
As the electric vehicle (EV) market gears up for exponential growth, recent projections from RBC Capital Markets indicate a promising trajectory. This surge in demand for EVs, driven by factors like price stability and charging infrastructure expansion, sets the stage for robust growth. Against this backdrop, Green River Gold emerges as a key player, strategically positioned to capitalize on the evolving dynamics of the mining industry.
Industry Outlook and Green River Gold’s Trajectory:
The electric vehicle (EV) market is poised for unprecedented growth, with RBC Capital Markets predicting a surge in demand for battery electric vehicles (BEVs). This aligns seamlessly with Green River Gold’s strategic trajectory, positioning the company as a key player in the evolving landscape of the mining industry. As the demand for BEVs rises, so does the significance of Green River Gold’s role in supplying essential minerals for their production.
Voices of Authority:
Industry leaders echo the optimism surrounding the electric vehicle market’s future. According to RBC Capital Markets, the consensus is that the market share for battery electric vehicles (BEVs) could reach 75% by 2050. Green River Gold’s executives align with this sentiment, underlining the company’s commitment to advancing mineral projects crucial for the electric vehicle revolution. Perry Little, President and CEO of Green River, affirms, “Our strategic focus positions us to play a vital role in the industry’s transformative journey.”
Green River Gold’s Highlights:
Green River Gold’s remarkable achievements, as outlined in the milestones, underscore the company’s commitment to industry leadership. The successful drilling campaign at the Quesnel Nickel Project, spanning 50 consecutive breakthroughs, aligns seamlessly with the industry’s trajectory. The strategic focus on nickel, magnesium, cobalt, and chromium positions Green River Gold as a key contributor to the imminent demand surge for minerals essential in electric vehicle production.
Real-world Relevance:
Green River Gold’s contributions extend beyond the mining industry, making a real-world impact on the electric vehicle revolution. As the demand for EVs rises, Green River Gold’s exploration efforts translate into a stable supply of essential minerals. This stability ensures the seamless production of electric vehicles, contributing to the global shift towards sustainable transportation. Investors can view Green River Gold not just as a mining company but as a driving force behind a greener, more sustainable future.
Looking Ahead with Green River Gold:
Looking ahead, Green River Gold stands at the forefront of the mining industry’s transformative journey. The company’s forward-looking goals align seamlessly with the optimistic industry forecast presented by RBC Capital Markets. Green River Gold’s strategic presence, coupled with its commitment to sustainable exploration, positions the company as a key player in shaping the future of mining. As the industry anticipates robust growth, investors have a unique opportunity to be part of Green River Gold’s promising journey towards a greener, more sustainable mining landscape.
Conclusion:
In conclusion, Green River Gold stands as a beacon of opportunity amid the surging tide of the electric vehicle revolution. As the industry gears up for substantial growth, Green River Gold’s strategic focus on exploration and commitment to advancing mineral projects places it at the forefront of this transformative wave. Investors keen on aligning with a company poised to navigate the currents of prosperity in a booming mining industry should delve deeper into Green River Gold’s promising journey.
This record is published on behalf of the featured company or companies mentioned (Collectively “Clients”), which are paid clients of Agora Internet Relations Corp or AGORACOM Investor Relations Corp. (Collectively “AGORACOM”)
AGORACOM.com is a platform. AGORACOM is an online marketing agency that is compensated by public companies to provide online marketing, branding and awareness through Advertising in the form of content on AGORACOM.com, its related websites (smallcapepicenter.com; smallcappodcast.com; smallcapagora.com) and all of their social media sites (Collectively “AGORACOM Network”) . As such please assume any of the companies mentioned above have paid for the creation, publication and dissemination of this article / post.
You understand that AGORACOM receives either monetary or securities compensation for our services, including creating, publishing and distributing content on behalf of Clients, which includes but is not limited to articles, press releases, videos, interview transcripts, industry bulletins, reports, GIFs, JPEGs, (Collectively “Records”) and other records by or on behalf of clients. Although AGORACOM compensation is not tied to the sale or appreciation of any securities, we stand to benefit from any volume or stock appreciation of our Clients. In exchange for publishing services rendered by AGORACOM on behalf of Clients, AGORACOM receives annual cash and/or securities compensation of typically up to $125,000.
Facts relied upon by AGORACOM are generally provided by clients or gathered by AGORACOM from other public sources including press releases, SEDAR and/or EDGAR filings, website, powerpoint presentations. These facts may be in error and if so, Records created by AGORACOM may be materially different. In our video interviews or video content, opinions are those of our guests or interviewees and do not necessarily reflect the opinion of AGORACOM.
Posted by Brittany McNabb
at 2:39 PM on Tuesday, November 28th, 2023
Introduction:
In a revolutionary shift, U.S. consumers are propelling electric vehicles (EVs) to the forefront of the automotive market, constituting a remarkable 9% of new car sales in 2023. As this surge continues, Infinity Stone Ventures stands poised to harness the momentum, strategically positioning itself in the rapidly evolving landscape of clean energy. Did you know in the U.S., there were roughly 136,000 EVs sold in September — a 67% year-over-year increase?
Industry Outlook and Infinity Stone Ventures’ Trajectory:
Against the backdrop of EVs claiming 9% of U.S. new car sales, Infinity Stone Ventures navigates the landscape with strategic prowess. The company’s trajectory aligns seamlessly with the burgeoning trends, ensuring it remains at the vanguard of the industry’s electrifying advancements. According to EIA, sales of hybrids, plug-in hybrids, and battery electric vehicles account for 15.8% of all new light-duty vehicle sales in the United States so far this year, compared with 12.3% in 2022 and 8.5% in 2021. While hybrids are more efficient in their use of gasoline, they do not offer the same benefits as all-electric vehicles.
Voices of Authority:
Industry leaders echo the sentiment that the EV sector’s ascent is undeniable, with a substantial 5 million new car sales dedicated to electric vehicles. These voices of authority resonate with Infinity Stone Ventures’ strategic direction, validating the company’s commitment to spearheading clean energy technologies.
Infinity Stone Ventures Highlights:
Framed against the backdrop of EVs claiming 9% of U.S. new car sales, their milestones underscore Infinity Stone Ventures’ pivotal role. The company’s innovative projects, strategic partnerships, and commitment to sustainability align seamlessly with the evolving market dynamics. Their partnership with R&D Innovations to use their patent-pending & proprietary air classification technology to mill graphite material into a fine graphite concentrate shows their potential for use as anode material in lithium-ion batteries.
Real-world Relevance:
With EVs becoming the new norm and an anticipated 5 million new sales, Infinity Stone Ventures plays a crucial role in the production of batteries, essential for the long-range electric cars dominating the market. Having refined graphite from its Rockstone Graphite Project to 99.73% Cg shows great significance for EV batteries.
Looking Ahead with Infinity Stone Ventures:
Positioned at the forefront of the green revolution, the company’s future goals mirror the optimistic trajectory of the EV industry, offering investors a compelling opportunity.
Conclusion:
In a landscape where electric mobility claims a substantial 9% share of U.S. new car sales, Infinity Stone Ventures stands as a key player, ready to shape the future of sustainable energy. This Industry Bulletin extends an invitation for potential investors to explore the unique opportunities within Infinity Stone Ventures, a company perfectly aligned with the accelerating surge in clean energy demand.
This record is published on behalf of the featured company or companies mentioned (Collectively “Clients”), which are paid clients of Agora Internet Relations Corp or AGORACOM Investor Relations Corp. (Collectively “AGORACOM”)
AGORACOM.com is a platform. AGORACOM is an online marketing agency that is compensated by public companies to provide online marketing, branding and awareness through Advertising in the form of content on AGORACOM.com, its related websites (smallcapepicenter.com; smallcappodcast.com; smallcapagora.com) and all of their social media sites (Collectively “AGORACOM Network”) . As such please assume any of the companies mentioned above have paid for the creation, publication and dissemination of this article / post.
You understand that AGORACOM receives either monetary or securities compensation for our services, including creating, publishing and distributing content on behalf of Clients, which includes but is not limited to articles, press releases, videos, interview transcripts, industry bulletins, reports, GIFs, JPEGs, (Collectively “Records”) and other records by or on behalf of clients. Although AGORACOM compensation is not tied to the sale or appreciation of any securities, we stand to benefit from any volume or stock appreciation of our Clients. In exchange for publishing services rendered by AGORACOM on behalf of Clients, AGORACOM receives annual cash and/or securities compensation of typically up to $125,000.
Facts relied upon by AGORACOM are generally provided by clients or gathered by AGORACOM from other public sources including press releases, SEDAR and/or EDGAR filings, website, powerpoint presentations. These facts may be in error and if so, Records created by AGORACOM may be materially different. In our video interviews or video content, opinions are those of our guests or interviewees and do not necessarily reflect the opinion of AGORACOM.
From time to time, reference may be made in our marketing materials to prior Records we have published. These references may be selective, may reference only a portion of an article or recommendation, and are likely not to be current. As markets change continuously, previously published information and data may not be current and should not be relied upon.
NO INVESTMENT ADVICE
This record, and any record we publish by or on behalf of our clients, should not be construed as an offer or solicitation to buy or sell products or securities.
You understand and agree that no content in this record or published by AGORACOM constitutes a recommendation that any particular security, portfolio of securities, transaction, or investment strategy is suitable or advisable for any specific person and that no such content is tailored to any specific person’s needs. We will never advise you personally concerning the nature, potential, advisability, value or suitability of any particular security, portfolio of securities, transaction, investment strategy, or other matter.
Neither the writer of this record nor AGORACOM is an investment advisor. Both are neither licensed to provide nor are making any buy or sell recommendations. For more information about this or any other company, please review their public documents to conduct your own due diligence.
Posted by Brittany McNabb
at 10:20 AM on Tuesday, November 28th, 2023
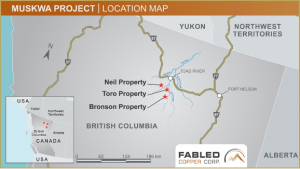
In the dynamic landscape of copper exploration, Fabled Copper Corp. emerges as a transformative force, breaking new ground on the Muskwa Copper Project. Today, the company proudly announces the reception of its Mines Act Permit, a pivotal milestone unlocking a two-year drilling endeavor across the Neil, Toro, and Bronson properties in northern British Columbia.
Background and Context:
Founded on a commitment to excellence, Fabled Copper Corp. has a rich history woven with successful explorations and unwavering dedication to responsible mining practices. The Muskwa Copper Project, comprising the Neil, Toro, and Bronson properties, has been granted the drilling permit, with the Davis Keays Eagle Vein area taking precedence. This marks the dawn of a groundbreaking chapter in the company’s legacy.
Key Highlights and Advantages:
First-ever Surface Drilling on Eagle Vein:
Fabled Copper Corp. embarks on an unprecedented journey with a helicopter-supported diamond drill program spanning 3,000 to 5,000 meters on the Davis Keays Eagle Vein. The magnitude of this endeavor is underscored by its historic nature, representing the inaugural surface drilling in the Eagle Vein area.
Precision Redefining Exploration:
Fabled Copper Corp.’s approach is not just about reaching the Eagle Vein; it’s about reshaping the understanding of the ore body. With cutting-edge technology ensuring a target accuracy of 3 cms, the company anticipates not just intercepting the Eagle Vein but unraveling a network of copper-bearing veins, potentially reshaping the future of the project.
Extending Reserves and Exploring Depths:
Building upon the legacy of the 1990 Feasibility Report, Fabled Copper Corp. aims to extend the known reserves below the 5,800-foot level. The potential of parallel veins, discovered during the 2022 work program, adds a layer of excitement to the prospect of uncovering new copper-rich domains.
Potential Impact and Significance:
The issuance of the Mines Act Permit is more than a regulatory approval; it’s a catalyst for potential game-changing discoveries. As Fabled Copper Corp. envisions the intersections of multiple copper-bearing veins, the reverberations extend beyond the company, influencing the industry’s outlook and investor sentiment.
Expert Opinions and Analysis:
Peter Hawley, President, CEO of Fabled Copper Corp., expresses the company’s enthusiasm, stating, “We are very excited to finally receive our long-awaited drill permit.” Industry analysts echo this sentiment, recognizing the strategic importance of the Muskwa Copper Project in an era where copper’s value is paramount.
Challenges and Considerations:
While the prospects are exhilarating, challenges and considerations are inherent. Fabled Copper Corp. acknowledges the need for funding to materialize this ambitious drill program. The company’s transparent approach to addressing challenges reflects a commitment to prudent financial management.
Conclusion:
In the heart of the Muskwa Copper Project, Fabled Copper Corp. is not merely exploring; it is pioneering a new era of copper exploration. The Mines Act Permit opens doors to possibilities that transcend conventional boundaries. As the company ventures into uncharted territories, investors are invited to witness the unfolding narrative of discovery and innovation. Fabled Copper Corp.’s commitment to responsible stewardship and its relentless pursuit of excellence make it a beacon in the evolving story of copper exploration.
Posted by AGORACOM
at 1:56 PM on Monday, January 27th, 2020
Sponsor: Loncor is a Canadian gold exploration company that controls over 2,400,000 high grade ounces outside of a Barrick JV.. The Ngayu JV property is 200km southwest of the Kibali gold mine, operated by Barrick, which produced 800,000 ounces of gold in 2018. Barrick manages and funds exploration at the Ngayu project until the completion of a pre-feasibility study on any gold discovery meeting the investment criteria of Barrick. Click Here for More Info
Barrick Gold’s Kibali mine beat its 2019 production guidance of 750,000 ounces by delivering 814,027 ounces
Kibali is 200km to the southwest of Loncor’s JV with Barrick in search for further Tier Once mining assets
KINSHASA, Democratic Republic of Congo, Jan. 27, 2020 (GLOBE NEWSWIRE) — Barrick Gold Corporation (NYSE:GOLD) (TSX:ABX) - Barrick Gold Corporation’s Kibali mine beat its 2019 production guidance of 750,000 ounces of gold by a substantial margin, delivering 814,027 ounces in another record year.
Barrick president and chief executive Mark Bristow told a media briefing here that Kibali’s continuing stellar performance was a demonstration of how a modern, Tier One gold mine could be developed and operated successfully in what is one of the world’s most remote and infrastructurally under-endowed regions.  He also noted that in line with Barrick’s policy of employing, training and advancing locals, the mine was managed by a majority Congolese team, supported by a corps of majority Congolese supervisors and personnel.
Already one of the world’s most highly automated underground gold
mines, Kibali continues its technological advance with the introduction
of truck and drill training simulators and the integration of systems
for personnel safety tracking and ventilation demand control. The
simulators will also be used to train operators from Barrick’s Tanzanian
mines.
“The completion of the Kalimva Ikamva prefeasibility study has
delivered another viable opencast project which will help balance
Kibali’s opencast/underground ore ratio and enhance the flexibility of
the mine plan. Down-plunge extension drilling at Gorumbwa has
highlighted future underground potential and ongoing conversion drilling
at KCD is delivering reserve replenishment. All in all, Kibali is well
on track not only to meet its 10-year production targets but to extend
them beyond this horizon,†Bristow said.
“We’re maintaining a strong focus on energy efficiency through
the development of our grid stabilizer project, scheduled for
commissioning in the second quarter of 2020. This uses new battery
technology to offset the need for running diesel generators as a
spinning reserve and ensures we maximize the use of renewable hydro
power. The installation of three new elution diesel heaters will also
help improve efficiencies and control power costs. It’s worth noting
that our clean energy strategy not only achieves cost and efficiency
benefits but also once again reduces Kibali’s environmental footprint.â€
Bristow said despite the pace of production and the size and complexity of the mine, Kibali was maintaining its solid safety and environmental records, certified by ISO 45001 and ISO 14001 accreditations. Â It also remained committed to community upliftment and local economic development. Â In 2019, it spent $158 million with Congolese contractors and suppliers and in December, it started work on a trial section for a new concrete road between Durba and the Watsa bridge.
Posted by AGORACOM
at 11:37 AM on Tuesday, January 21st, 2020
Sponsor: Loncor is a Canadian gold exploration company that controls over 2,400,000 high grade ounces outside of a Barrick JV. Exploration is currently being conducted by Barrick. The Ngayu property is 200km southwest of the Kibali gold mine, operated by Barrick, which produced 800,000 ounces of gold in 2018. Barrick manages and funds exploration at the Ngayu project until the completion of a pre-feasibility study on any gold discovery meeting the investment criteria of Barrick. Click Here for More Info
Gold is a hedge against inflation that is being used more and more
Goldex CEO pointed to a recent Goldman Sachs report that pointed to gold as being a better hedge than oil.
This view is the new consensus that will increase demand for gold.
(Kitco News) What can take the
gold market from $1,550 to $1,600 and higher? Goldex CEO and founder
Sylvia Carrasco told Kitco News that she is not ruling out the $1,900 an
ounce level this year if geopolitical and trade tensions escalate in
the current economic climate.
There are a number of strong drivers supporting gold prices this
year, including geopolitical and trade tensions, global debt, dovish
central banks, weakening U.S. dollar as well as the political situation
in the U.S., Carrasco said on Thursday.
“Last year, I said that the perfect storm was forming and I think I
would use this phrase again. The perfect storm is now happening,”
Carrasco noted. “Gold should be around $1,600 if nothing else crazy
happens. At this moment in time, I can see gold between the $1,500 and
the $2,000 mark during 2020.”
If the market sees a further increase in geopolitical tensions or
additional trade concerns this year, gold will surge towards $1,900,
Goldex CEO pointed out. And if things do calm down, Carrasco does not
see gold falling much below $1,500 an ounce.
“It is going to be another record year,” she said, referring to gold
hitting record-highs in many currencies last year. “And it will be
mainly due to geopolitical tensions raising prices higher.”
“With the current economic climate, gold should be between $1,500 and
$1,600. If on top of that bare minimum, you add very strong
geopolitical tensions or commercial trade issues, then you take it from
$1,600 up to $1,900,” she added.
At the time of writing, the spot gold price was trading at $1,560.40,
up 0.24% on the day and up 2.8% since the start of the year.
Gold is a hedge against inflation that is being used more and more by
investors who are realizing the benefits of the yellow metal, Carrasco
said.
“Gold is the hedge that people should be using. I wouldn’t build my
personal wealth portfolio just on gold. But gold is more and more
clearly overtaking oil and any other hedging mechanisms … Gold will be a
good trade whether for speculative reasons or for trading,” she noted.
Goldex CEO pointed to a recent Goldman Sachs report
that pointed to gold as being a better hedge than oil. Carrasco added
that this view is the new consensus that will increase demand for gold.
Gold began the year with a bang as U.S.-Iran tensions flared up and surprised the markets in the first two weeks of January.
“The rally we’ve seen is based on geopolitical tensions between the
U.S. and Iran. We need to see also the reasons behind Trump’s approach
when it comes to Iran … In September, the U.S. ended up a positive net
exporter of oil for the first time in history. That gives you a reason
why Trump thinks he is not affected by the tensions even though the rest
of the world is affected,” Carrasco described.
Also, U.S. President Donald Trump was driven by the goal to distract
the market from the impeachment proceedings against him, she added.
Going forward, gold prices are likely to rise further, especially
considering that most of the major central banks around the world are
not planning to start raising rates any time soon.
“Central banks using unconventional ways … Is there going to be an
increase in interest rates in Europe or in the U.S.? The answer is no.
And if interest rates are not going to increase, gold is the first one
that is affected,” Carrasco said.
On top of that, the central banks will remain significant gold buyers
in 2020. “That’s another reason why gold prices will increase this
year,” she said.
Growing debt also supports higher gold prices this year, the CEO
added. “We’ve been talking about debt for years — how corporate debt and
government debt continues to increase. More debt effectively means a
potentially weaker U.S. dollar. The moment the U.S. dollar is weak,
where do you go? The only safe place is gold. And I think we are going
to be seeing a weakening dollar as the year continues,” Carrasco
described.
Posted by AGORACOM
at 12:32 PM on Friday, January 17th, 2020
Sponsor: Loncor is a Canadian gold exploration company focused on two projects in the DRC – the Ngayu and North Kivu projects, both have historic gold production. Exploration at the Ngayu project is currently being undertaken by Loncor’s joint venture partner Barrick Gold. The Ngayu project is 200km southwest of the Kibali gold mine, operated by Barrick, which produced 800,000 ounces of gold in 2018. Barrick manages and funds exploration at the Ngayu project until the completion of a pre-feasibility study on any gold discovery meeting the investment criteria of Barrick. Click Here for More Info
From the HRA Journal: Issue 314
The fun doesn’t stop. Waves of liquidity continue to wash traders
cares away. Even assassinations and war mongering generate little more
than half day dips on Wall St. It seems nothing can get in the way of
the bull rally that’s carrying all risk assets higher.
It feels like it could go on for a while, though I think the
liquidity will have to keep coming to sustain it. By most readings,
bullishness on Wall St is at levels that are rarely sustained for more
than a few weeks. Some sort of correction on Wall St seems highly
likely, and soon. Whether its substantial or just another blip on the
way higher remains to be seen.
The resource sector, especially gold and silver stocks, have had
their own rally. Our Santa Claus market was as good or better than Wall
St’s for a change. And I don’t think its over yet. I think we’re in for
the best Q1 we’ve seen for a few years. And we could be in for something
better than that even. I increasingly see signs of a major rally
developing in the gold space. It’s already been pretty good but I think a
multi-quarter, or longer, move may be starting to take shape.
I usually spend time on all the metals in the first issue of the
year. But, because the makings of this gold rally are complex and long
in coming I decided to detail my reasoning. That ended up taking several
pages so I’ll save talk on base metals and other markets for the next
issue.
No, I’m not writing about Louis IV, though there might be some
appropriateness to the analogy, now that I think about it. The quote is
famous, even though there’s no agreement on what it was supposed to
mean. Most figure Louis was referring to the biblical flood, that all
would be chaos once his reign ended.
The deluge I’m referring to isn’t water. It’s the flood of money the
US Fed, and other central banks, continue to unleash to keep markets
stable. Markets, especially stock markets, love liquidity. You can see
the impact of the latest deluge, particularly the US Fed’s in the chart
below that traces both the SPX index value and the level of a “Global
Liquidity Proxy” (“GLP”) measuring fiscal/monetary tightness and
weakness.
You can see the GLP moved lower in late 2018 as the Fed tightened and
the impact that had on Wall St. Conversely, you can see the SPX running
higher in the past couple of months as the US backed off rate
increases, increased fiscal deficit expansion, and grew the Fed balance
sheet through, mainly, repo market operations.
Wall St, and most other bourses, are loving these money flows. The
Santa Claus rally discussed in the last issue continued to strengthen
all the way to and through year end. As it turned out, the Fed either
provided enough backstop in advance or the yearend repo issues were
overstated. The repo market itself was calm going through year end and a
lot of the short-term money offered by the Fed during that week wasn’t
taken down.
Everything may have changed in the past couple of days with the
dramatic increase in US-Iran tensions. I don’t know how big an issue
that will be, since no one knows what form Iran’s retaliation will be or
how much things will escalate. I DO think it’s potentially a big deal
with very negative connotations, but it may take time to unfold. Someone
at the Fed thought so too, as the past couple of days saw a return to
large scale Fed lending in the repo market.
I’ve no doubt Iran will try and take revenge for the assassination of
its most famous military commander by the US. But I don’t know what
form it will take and if this means the US has drawn itself into the
Mideast quagmire even more. I fear it has though. The US is already
talking about adding 3,000 troops to its Mideast presence and they’re
just warming up. Even larger scale attacks, if they happen, may not
derail Wall St, but they’re certainly not a positive development at any
level.
We know how stretched both market valuations and sentiment were
before the Suleimani drone strike. The chart below shows a three-year
trace of the “fear/greed index”. You can see that its hardly a stable
reading. It flip flops often and extreme readings rarely hold for long.
At last check, the reading was 94% bullish.
Sentiment almost never gets that bullish and, when it does, nothing
good comes of it for bulls. A reading that close to 100% tells you we’re
just about out of buyers. Whatever happens in and around Iran, I think a
near term correction is inevitable. The only question is whether it’s a
large one or not.
A rapid escalation in US-Iran tensions could certainly make a near
term correction larger. If the flood of liquidity continues though, a
correction could just be another waystation on the road to higher highs.
There are a couple of other dangers Wall St still faces that I’ll touch
on briefly at the end of this article. First however, lets move on to
the main event for us-the gold market.
It wasn’t just the SPX enjoying a Santa rally this year. Gold
experienced the rally we were hoping for that gold miner stocks seemed
to be foretelling early last month. Gold’s been doing well since it
bottomed at $1275 in June, but it didn’t feel that way during the long
hiatus between the early September high and the current move. The gold
price currently sits above September’s multi-year high, after breaching
that high in the wake of the Baghdad drone strike. And the first
retaliatory strike by Iran. Volatility will be very high for a while
going forward.
I think we’ll see more multi-year highs going forward. I hate that
the latest move higher is driven by geopolitics. Scary geopolitics and
military confrontations mean people are dying. We don’t want to profit
from misery. And we won’t anyway, if things get ugly enough in the
Mideast to scare traders out of the market.
Geopolitical price moves almost always unwind quickly. I’d much
prefer to see gold moving higher for macro reasons, not as a political
safety trade. I expect more political/military inspired moves. As the
Iran conflict unfolds. Make no mistake, Iran is NOT Iraq. Its army is
far larger, better trained and better equipped than Iraq. This could get
ugly.
The balance of this piece will deal with my macro argument for higher
gold prices over an extended period. The geopolitical stuff will be
layered on top of that for the next while and could strengthen both gold
prices and the $US in risk-off trading. It should be viewed as a
separate event from the argument laid out below.
What else is driving gold higher? In part, it was gold’s inverse
relationship with the US Dollar. As you already know, I’m not a believer
that “its all about the USD, all the time” when it comes to the gold
market. That’s an over-simplification of a more complex relationship. It
also discounts the idea of gold as its own asset class that trades for
its own reasons.
If you look at the gold chart above, and the USD chart below it, its
immediately apparent that there isn’t a constant negative correlation at
play. Gold rallied during the summer at the same time the USD did and
for the same reason; the world-wide explosion of negative real yields.
Gold weakened a bit when yields reversed to the upside and the USD got a
bit of traction, but things changed again at the start of December.
The USD turned lower and lost two percent during December. US bond
yields were generally rising during the month and the market (right or
wrong) was assuming economic growth was accelerating. So, neither of
those items explains the USD weakness.
If gold was a “risk off” trade, you sure couldn’t see it in the way
any other market was trading. So, is there another explanation for
recent strength in the gold price, and what does it tell us about 2020
and, perhaps, beyond?
Well, I’ve got a theory. If I’m right, it could mean a bull run for gold has a long way to go.
Some of this theory will be no surprise to you because it does
partially hinge on further USD weakness. There are long term structural
reasons why the US currency should weaken. But there are also
fluctuating sources of demand for USDs, particularly from offshore
buyers and borrowers that transact in US currency. That can create
enough demand to strengthen the US over long periods. We just went
though one such period, but it looks like that may have come to an end,
with more bearish forces to the USD reasserting themselves.
How did we get here? Let’s start with the big picture, displayed on
the top chart on the next page. It gives a long-term view of US Federal
deficits and the unemployment rate. Normally, these travel in tandem.
Higher unemployment means more social spending and higher deficits.
Government spending expands during recessions and contracts-or should-
(as a percentage of GDP) during expansions. Classic Keynesian stuff.
You rarely see these two measures diverge. The two times they did
significantly before, on the left side of the chart, was due to “wartime
deficits” which acted (along with conscription) to stimulate the
economy and drive down unemployment.
You can see the Korean and Vietnam war periods pointed out on the chart.
The current period stands out for the extreme size of the divergence.
US unemployment rates are at multi decade lows and yet the fiscal
deficit as a percentage of GDP keeps rising. There has never been a
divergence this large and its due to get larger.
We know why this is. Big tax cuts combined with a budget that is
mostly non-discretionary. And the US is 10 years into an economic
expansion, however weak. Just think what this graph will look like the
next time the US goes into recession.
We can assume US government deficits aren’t going to shrink any time
soon (and I think we can, pun intended, take that to the bank). That
leaves trade in goods to act as a counterbalance to the funding demand
created by fiscal deficits.
The chart above makes it clear the US won’t get much help from
international trade. The US trade balance has been getting increasingly
negative for decades. It’s better recently, but unlikely to turn
positive soon, and maybe not ever.
To be clear, this is not a bad thing in itself, notwithstanding the
view from the White House. The relative strength of the US economy and
the US Dollar and cheaper offshore production costs have driven the
trade balance. It’s grown because Americans found they got more value
buying abroad and the world was happy to help finance it. It’s not a bad
thing, but not a US Dollar support either.
The more complete picture of currency/investment flows is given by
changes in the Current Account. In simplified terms, the Current Account
measures the difference between what a country produces and what it
consumes. For example, if a country’s trade deficit increases, so does
its current account deficit. If there are funds flowing in from overseas
investments on the other hand, this decrease the Current Account
deficit or increase the surplus.
The graph below summarizes quarterly changes in the US current
account. You can see how the balance got increasingly negative in the
mid 2000’s as both imports and foreign investment by US companies
increased.
Not coincidentally, this same period leading up to the Financial
Crisis included a sustained downtrend in the US Dollar Index. The USD
index chart on the bottom of the next page shows the scale of that
decline, from an index value of 120 at the start of 2002 all the way
down to 73 in early 2008.
The current account deficit (and value of the USD) improved markedly
up to the end of the Financial Crisis as money poured into the US as a
safe haven and consumers cut back on imports. The current account
deficit bas been relatively stable since then, running at about
$100bn/quarter until it dipped a bit again last year.
Trade, funds flows and changes in money supply have the largest
long-term impacts on currency values. When the US Fed ended QE and
started tightening monetary conditions in 2014, the USD enjoyed a strong
rally. The USD Index was back to 100 by early 2015 and stayed there
until loosening monetary conditions-and lots of jawboning from
Washington-led to pullback. Things reversed again and the USD maintained
a mild uptrend from early 2018 until now.
There are still plenty of US Dollar bulls around, and their arguments
have short-term merit. Yes, the US has higher real interest rates and
somewhat higher growth. Both are important to relative currency
valuations as I’ve said in the past. Longer term however, the “twin
deficits” -fiscal and current account-should underpin the fundamental
value of the currency.
Movements don’t happen overnight, especially when you’re talking
about the worlds reserve currency that has the deepest and largest
market supporting it. Changing the overall trend for the USD is like
turning a supertanker. I think it’s happening though, and it has big
potential implications for commodities, especially gold.
Dollar bulls will tell you the USD is the “cleanest shirt in the
laundry hamper”, referring to the relative strength of the growth rate
and interest rates compared to other major currencies. That’s true if we
just look at those measures but definitely not true when we look at the
longer term-fiscal and current account deficits.
In fact, the US has about the worst combined fiscal/current account deficit in the G7. The chart at the bottom of this page, from lynalden.com
shows the 2018 values for Current Account and Trade balances for a
number of major economies, as a percentage of their GDP. It’s not a
handsome group.
Both the trade and current account deficits are negative for most of
them. In terms of G7 economies, the US has the worst combined
Current/Trade deficit at 6% of GDP annually. You may be surprised to
note that the Current/Trade balance for the Euro zone is much better
than the US, thanks to a large Trade surplus. Much of that is generated
by Germany. Indeed, this chart explains Germanys defense of the Euro.
It’s combined Trade/Current Account surplus is so large it’s currency
would be skyrocketing if it still used the Deutschmark.
Because the current account deficit is cumulative, the overall
international investment position of the US has continued to worsen. The
US has gone from being an international creditor to an international
debtor, and the scale if its debt keeps increasing. That means it’s
getting harder every year to reverse the current account position as the
US borrows ever more abroad to cover its trade and fiscal deficits.
Interest outflows keep growing and investment inflows shrinking.
Something has to give.
The US has to borrow overseas, as private domestic demand for
Treasury bonds isn’t high enough to fund the twin deficits. In the past,
whenever the US Dollar got too high, offshore demand for US government
debt diminished. It’s not clear why. Maybe the higher dollar made
raising enough foreign funds difficult, or perhaps buyers started
worrying about the USD dropping after they bought when it got too
expensive. Whatever the reason, foreign holdings of US Treasuries have
been declining, forcing the US to find new, domestic, buyers.
Last year, the US Fed stopped its quantitative tightening program,
due to concerns about Dollar liquidity. Then came the repo market. Since
September, the Fed’s balance sheet has expanded by over $400 billion,
mainly due to repo market transactions.
The Fed maintains this “isn’t QE” because these are very short duration transactions but, cumulatively, the total Fed balance sheet keeps expanding. The “QE/no QE” debate is just semantics.
What do these transactions look like? Mostly, its Primary Dealers,
banks that also take part in Treasury auctions, in the repo market. The
Fed buys bonds, usually Treasuries, from these banks and pays for them
in newly printed Dollars. That injects money into the system, helps hold
down interest rates in the repo market and, not coincidentally,
effectively helps fund the US fiscal deficit. To put the series of
transactions in their simplest form, the US is effectively monetizing its deficit with a lot of these transactions.
The chart below illustrates the problem for the Primary Dealer US
banks. They’ve got to buy Treasuries when they’re auctioned-that is
their commitment as Primary Dealers. They also need to hold minimum cash
balances as a percentage of assets under Basel II bank regulations.
Cash balances fell to the minimum mandated level by late 2019- the
horizontal black line on the chart. That’s when the trouble started.
These banks are so stuffed with Treasuries that they didn’t have
excess cash reserves to lend into the repo market. Hence the blow up
back in September and the need for the Fed to inject cash by buying
Treasuries. The point, however, is that this isn’t really a “repo market
issue”, that’s just where it reared its head. It’s a “too many
Treasuries and not enough buyers” problem.
It will be tough for the Treasury to attract more offshore buyers
unless the USD weakens, or interest rates rise enough to make them
irresistible. Or a big drop in the federal deficit reduces the supply of
Treasuries itself.
I doubt we’ll see interest rates move up significantly. I don’t think
the economy could handle it and it would be self-defeating anyway, as
the government deficit would explode because of interest expenses. And
that’s not even taking into account the fact that President Trump would
be freaking out daily.
Based on recent history and political expediency, I’d say the odds of
significant budget deficit reductions are slim and none. That’s
especially true going into an election year. There’s just no way we’re
going to see spending restraint or tax increases in the next couple of
years. Indeed, the supply of Treasuries will keep growing even if the US
economy grows too. If there is any sort of significant slowdown or
recession the Federal deficit will explode and so will the new supply of
Treasures. Not an easy fix.
Barring new haven demand for US Treasuries, odds are the Fed will
have to keep sopping up excess supply. That means expanding its balance
sheet and, in so doing, effectively increasing the US money supply.
That brings us (finally!) to the “money shot” chart that appears
above. It compares changes in the size of the Fed balance sheet and the
US Dollar Index. To make it readable and allow me to match the scales, I
generated a chart that tracks annual percentage changes.
The chart shows a strong inverse correlation between changes in the
size of the Fed balance sheet and the value of the USD. This is
unsurprising as most transactions that expand the Fed balance sheet also
expand the money supply.
It’s impossible to tell how long the repo market transactions will
continue but, after three months, they aren’t feeling very “temporary”.
To me, it increasingly looks like these market operations are “debt
monetization in drag”.
I don’t know if that’s the Fed’s real intent or just a side effect.
It doesn’t really matter if the funding and money printing continues at
scale. Even if the repo market calms completely, the odds are good we
see some sort of “new QE” start up. Whatever official reason is given
for it; I think it will happen mainly to soak up the excess supply of
Treasuries fiscal deficits are creating.
I don’t blame the FOMC if they’re being disingenuous about it. That’s
their job after all. If you’re a central banker, the LAST thing you’re
going to say is “our government is having trouble finding buyers for its
debt”, especially if its true.
With no prospect of lower deficits and apparent continued reduction
in offshore Treasury holdings, this could develop into long-term
sustained trend. I don’t expect it to move in a straight line, markets
never do. A severe escalation in Mideast tensions or the start of a
serious recession could both generate safe-haven Treasury buying. Money
flows from that would take the pressure off the Fed and would be US
Dollar supportive too.
That said, it seems the US has reached the point where a substantial
increase in its central bank’s balance sheet is inevitable. Both Japan
and the Eurozone have gotten there before the Fed, but it looks like it
won’t be immune.
The Eurozone at least has a “Twin surplus” to help cushion things.
And Japan, considered a basket case economically, had an extremely deep
pool of domestic savings (far deeper than the US) to draw on. Until very
recently, Japan also ran massive Current Account surpluses thanks to
decades of heavy investments overseas by Japanese entities. Those
advantages allowed the ECB and especially the BoJ to massively expand
their balance sheets without generating a huge run up in interest rates
or currency collapse.
I don’t know how far the US Fed can expand its balance sheet before
bond yields start getting away from it. I think pretty far though.
Having the world’s reserve currency is a massive advantage. There is
huge built in demand for US Dollars and US denominated debt. That gives
the Fed some runway if it must keep buying US Treasuries.
Assuming a run on yields doesn’t spoil the party, continued balance
sheet and money supply expansion should put increasing downward pressure
on the US Dollar. I don’t know if we’ll see a move as large as the
mid-2000s but a move down to the low 80s for the USD Index over the
course of two or three years wouldn’t be surprising.
It won’t be a straight-line move. A recession could derail things,
though the bear market on Wall St that would generate would support
bullion. Currency markets tend to be self-correcting over extended
periods. If the USD Index falls enough and there is a bump in US real
interest rates offshore demand for Treasuries should increase again.
The bottom line is that this is, and will continue to be, a very
dynamic system. Even so, I think we’ve reached a major inflection point
for the US currency. The 2000s were pretty good for the gold market and
gold stocks. We started from a much lower base of $300/oz on the gold
price. Starting at a $1200-1300 base this time, I think a price above
$2000/oz is a real possibility over the next year or two.
It’s not hard to extrapolate prices higher than that, but I’m not
looking or hoping for those. I prefer to see a longer, steadier move
that brings traders along rather than freaking them out.
This prediction isn’t a sure thing. Predictions never are. But I
think the probabilities now favor an extended bull run in the gold
price. Assuming stock markets don’t blow up (though I still expect that
correction), gold stocks should put in a leveraged performance much more
impressive than the bullion price itself.
There will be consolidations and corrections along the way, but I
think there will be many gold explorers and developers that rack up
share price gains in the hundreds of percent. That doesn’t mean buying
blindly and never trading. We still need to adjust when a stock gets
overweight and manage risk around major exploration campaigns. The last
few weeks has been a lot more fun in the resource space. I don’t think
the fun’s over yet. Enjoy the ride.
Like any good contrarian, a 10-year bull market makes me alert of
signs of potential trouble. As noted at the start of this editorial, I’m
expecting continues floods of liquidity. That may simply overwhelm
everything else for a while and allow Wall St to keep rallying, come
what may.
That said, a couple of data points recently got my attention. One is
more of a sentiment indicator, seen in the chart below. More than one
wag has joked that the Fed need only worry about Wall St, since the
stock market is the economy now. Turns out there is more than a bit of
truth to that.
The chart shows the US Leading Indicator reading with the level of
the stock market (which is a component of the official Leading
Indicator) removed. As you can see, without Wall St, the indicator
implies zero growth going forward. I’m mainly showing it as evidence of
just how surreal things have become.
The chart above is something to keep an eye on going forward. It
shows weekly State unemployment claims for several major sectors of the
economy. What’s interesting about this chart is that claims have been
climbing rapidly over the past few weeks. Doubly interesting is that the
increase in claims is broad, both within and across several sectors of
the economy.
I take the monthly Non-Farm Payroll number less seriously than most,
because it’s a backward-looking indicator. This move in unemployment
claims looks increasingly like a trend though. It’s now at its highest
level since the Financial Crisis.
It’s not in the danger zone-yet. But its climbing fast. We may need
to start paying more attention to those payroll numbers. If the chart
below isn’t a statistical fluke, we may start seeing negative surprises
in the NFP soon. That won’t hurt the gold price either.
Source and Thanks: https://www.hraadvisory.com/golds-big-picture
Posted by AGORACOM
at 1:55 PM on Thursday, January 9th, 2020
Sponsor: Loncor is a Canadian gold exploration company focused on two projects in the DRC – the Ngayu and North Kivu projects, both have historic gold production. Exploration at the Ngayu project is currently being undertaken by Loncor’s joint venture partner Barrick Gold. The Ngayu project is 200km southwest of the Kibali gold mine, operated by Barrick, which produced 800,000 ounces of gold in 2018. Barrick manages and funds exploration at the Ngayu project until the completion of a pre-feasibility study on any gold discovery meeting the investment criteria of Barrick. Click Here for More Info
Another year of covering commodities and select junior mining stocks is all but done and dusted.
We’ve seen palladiumprices
more than double those of platinum, its sister metal, on tight supply
and high demand for catalytic converters in gas-powered vehicles, as
smog-belching diesel cars and trucks get phased out to meet tighter air
emissions standards particularly in Europe and China.
Indonesia advanced a 2022 deadline for banning the export of mineral ores, including nickel,
prompting a massive surge in the price of the stainless steel and
electric-vehicle battery ingredient. In September, nickel powered past
$8 a pound, before slipping back to around $6/lb after the resumption of
Indonesian ore exports and weaker demand from the stainless
steel industry.
Palladium and nickel are both in-demand metals for the foreseeable
future, nickel for its use in batteries and stainless steel, and
palladium as an important ingredient of catalytic converters found in
gas-powered/ hybrid vehicles.
Zinc inventories
in February fell to the point where there were less than two days worth
of global consumption locked in London Metal Exchange (LME) warehouses.
The paucity of the metal used to prevent rusting caused prices to spike
to the highest since June 2018.
Gold started off the year around $1,300/oz,
and didn’t do much for the first half on account of higher interest
rates holding prices down. In July though, gold started to run when the
US Federal Reserve reversed course and began cutting interest rates
instead of raising them. The ECB and a number of other central banks
followed suit, wanting to keep interest rates low to try and boost
flagging economic growth.
The yellow metal advanced
to $1,550 in early September due to a combination of factors including
negative real interest rates (always good for gold), a sluggish dollar,
and safe haven demand owing to US tensions with Iran, impeachment,
Brexit fears, etc.
Copper had an off year in 2018 over fears of slowing
Chinese growth and the US-China trade war, but as we at AOTH have
always maintained, the market fundamentals are solid. Over
200 copper mines currently in operation will reach the end of their
productive life before 2035. Most of the low-hanging copper “fruit†has
been picked. New copper mines will be lower-grade and farther afield,
meaning higher capex and production costs.
Although copper prices suffered in the second and third quarter,
things are looking up for the essential base metal needed for plumbing
and wiring, power generation, communications, 5G networks, and electric
vehicles, which use around four times as much copper as a conventional
car or truck.
Energized by a rip-roaring fourth quarter, copper bulls are back on
board. From its 52-week low in August of $2.51/lb, the red metal gained
an impressive 11%, reaching a pinnacle of $2.83/lb Dec. 12, on
expectations of a trade war resolution between the world’s number one
and two economies, and the improved economic growth prospects that would
entail. Copper has risen 7% in December alone.
We pinned our thesis on three key points: 1/ Commodities are
cyclical, and the timing is right to get in now; 2/ The US dollar
is falling, and will likely continue to fall or be range-bound going
forward. A resolution to the trade war between the US and China, and a
looser monetary policy by the Federal Reserve (both of which are likely)
will weigh on the dollar and be good for commodities; 3/ The need for
infrastructure spending is not going to let up.
Close to a year later, our commodities hypothesis rings true. The dollar’s upward march in 2018 (DXY moved from 89 to 97) did stop
in 2019, helping commodities priced in US dollars. The US-China trade
war escalated but as we predicted, there was a resolution – not a
complete trade deal – but enough hope for one, to send copper, the most
important base metal, soaring in recent weeks.
At the beginning of the year, as stock markets bounced back from
their awful fourth-quarter 2018, everyone thought that the US economy
was roaring. We weren’t so sure, and presented evidence of a less
sanguine picture including negative fallout from the trade war with
China and a yield curve inversion which is a very accurate indicator of a
coming recession.
The US Federal Reserve appeared to agree. Worried about low growth,
globally and in the US, the Fed slammed the brakes on the interest rate
hikes it started in 2015, and began lowering them in July, 2019. That
immediately juiced gold and silver. Investors piled into precious metals as an alternative to near-zero or negative-yielding sovereign bonds. Looser monetary policy, check.
In later articles we showed the bullish cases for zinc, nickel and palladium.
The palladium price tripled from the start of 2016 to spring of 2019,
beating gold just under a year ago for the first time in 16 years.
Palladium has been in deficit for eight straight years, because of low
mined output and smoking-hot demand from the auto sector. So far in 2019
it has gained 47%.
Battery companies have been developing nickel-rich batteries in
two of the dominant chemistries for EVs, the nickel-manganese-cobalt
(NMC) battery used in the Chevy Bolt (also the Nissan Leaf and BMW i3)
and the nickel-cobalt-aluminum (NCA) battery manufactured by
Panasonic/Tesla. Added to Indonesia’s on and off export ban, a demand
boost from nickel’s growing use in electric-vehicle batteries, and
dwindling global stockpiles, have helped support nickel prices.
According to the USGS, despite new zinc mines opening in Australia
and Cuba, supply failed to keep up with consumption. Some very large
zinc mines have been depleted and shut down in recent years, with not
enough new mine supply to take their place. As a result, the zinc market
was in deficit in 2018.
Tighter environmental restrictions in China are lessening the amount
smelters can produce. National production of refined zinc in 2018 fell
to just 4.53 million tonnes, the sharpest downturn since 2013. The
result has been a record amount of refined zinc imported by the world’s
largest metals consumer, 715,355t in 2018. The high demand in China has
also pulled a lot of zinc out of LME warehouses.
In October zinc prices hit a four-month high due to falling zinc
stocks – inventories in London Metal Exchange-registered warehouses
plunged to 57,775 tonnes – a smidgen higher than the 50,425t in April,
the lowest since the 1990s, Reuters said.
Tough market for explorers
It’s good to see we were right about so many metal markets.
Regrettably however, the valuations of mineral exploration companies
have yet to follow the prices of the metals they are hunting.
Indeed the junior mining sector has been in a funk since around 2012.
The juniors’ place in the mining food chain is to provide projects to
be turned into mines for larger mining companies whose reserves are
running low. This is becoming a growing problem as all the low-hanging, high-grade deposit fruit has been picked. Such is the case for gold, silver, copper, palladium,
zinc and nickel, all of which are encountering, or will shortly
encounter, supply deficits, amid booming demand for battery metals and
precious metals.
Finding the kind of grades at amounts that will make a mine
profitable usually requires going farther afield or deeper – greatly
adding to costs per ounce or tonne.
Here’s the problem juniors have been facing: At the same time as
investment capital has been pulled out of the mining majors and
mid-tiers – by investors tired of seeing falling or stagnant stock
prices/ red ink balance sheets – there’s been a dearth of speculative
capital flowing into exploration companies.
The ascendance of index funds has also made it harder for juniors to
attract money, because they are too small to be in the funds that these
vehicle track.
According to a 2019 report by PDAC –
the association that puts on the annual mining show in Toronto –
and Oreninc, a junior financing tracker, equity financing in 2018 was
35% less than in 2017 – a decade-low $4.1 billion.
A good chunk of that cash went to marijuana stocks, as dozens of
companies emerged to take advantage of the pot legalization bill passed
by the Canadian federal government. Whereas weed stock IPOs attracted
$491.1 million in investment dollars in 2018, mining IPOs only accounted for $51.6 million, a startling drop from the $830 million in 2017.
That’s a lot of speculative capital pulled out of resource stocks.
However it’s not all gloom and doom, according to TD Securities mining
investment bankers, who say “current market conditions and historical
precedents make them optimistic generalist investors will return in
greater numbers to mining stocks,†Bloomberg reported:
“The current market is reminiscent of the late 90’s and early 2000’s,
[TD Securities’ Deputy Chairman Rick] McCreary says. At the time,
investors had low interest in mining, and companies found it hard to
raise capital. That was followed by waves of consolidation and a mining
bull run. A similar trend may be building as this ‘period of
consolidation’ rolls on.â€
Gold M&A
As far as that goes, mining companies, especially in the gold space,
have realized since the vicious 2012-16 bear market, they have cut as
much as they can and the next step is to bring assets and companies
together. On top of that, the top gold miners are running out of
reserves, and are looking to replace them with high-margin projects that
have the right combination of grade, size and infrastructure.
This explains Barrick combining with South Africa’s Randgold, the Barrick-Newmont joint venture in Nevada,
the fusing of Newmont and Goldcorp, a $1-billion deal for Lundin Mining
to acquire a Brazilian copper-gold mine from Yamana Gold, Newcrest’s
70% purchase of Imperial Metals’ Red Chris mine in British Columbia, and
other recent examples of gold mining M&A.
Among December’s gold deals are Zijin Mining’s cash purchase of
Continental Gold’s Buriticá project in Colombia, for CAD$1.3 billion;
and a $770 million merger between two mid-tier gold miners, Equinox Gold
and Leagold Mining. The latter arrangement will keep the Equinox name
and create a company valued at $1.75 billion with six mines spread
across Brazil, Mexico and the United States.
Junior resource M&A?
The goal of every junior resource investor is for the company(ies)
they are invested in to get bought out, resulting in a 5, 10, even
20-bagger.
The question is, will the current round of mergers and acquisitions
at the major and mid-tier level trickle down to the juniors? PwC appears
hopeful. In its 2019 report ‘Shifting Ground’ the mining consultancy states,
The heightened level of deal activities, most of which have been
in the gold sector, may well spark further moves among intermediate
players seeking to grow into multi-project companies. A new phase of
industry consolidation could pave the way for more exploration and mine
development and boost investor interest and activity.
Another optimistic opinion comes from Tom Palmer, chief operating officer at Newmont, who told the Wall Street Journal that smaller
players are waiting to see what the bigger miners sell once they have
completed their mergers before they start their own M&A.
“Fast forward two or three years, there will be countless more†mergers, he said.
In fact we are already starting to see this happening. Nevada has
witnessed the return of junior gold explorers, and majors, after a lull
in activity between 2012 and 2016. According to an industry report,
exploration in Nevada increased by 15% in 2017, with 19,040 new claims.
The tide has continued to turn in mining’s favor, with 198,337 active
claims as of January, 2019 – 7% more than in 2018.
In 2018 Idaho-based Hecla Mining snapped up Klondex Mines for US$462
million, delivering three more Nevada properties – Fire Creek, Midas and
Hollister – to Hecla’s stable of mines and adding 162,000
gold-equivalent ounces to its annual production.
Also in Nevada, last year Alio Gold paid Rye Patch Gold $128 million
for the Vancouver-based company and its past-producing Florida Canyon
mine.
The 2019 creation of Nevada Gold Mines (the Barrick-Newmont JV) has
piqued the interest of other companies looking to discover and develop
new ounces in the golden state. Major miners with new projects include
AngloGold Ashanti, Coeur Mining and Kinross Gold. For the details read Getchell’s Gold
And for an inspiring story of junior mining success in Canada, look
no further than Great Bear Resources. Working the historic Red Lake gold
camp in Ontario, Great Bear’s drills discovered the “LP Fault Zoneâ€
this past May. That eureka moment, the realization that most of the gold
on its property is structurally controlled, prompted a massive 90,000m
drill program aimed at identifying the parameters. The discovery of
three new gold zones with high-grade intercepts, along with the earlier
nearby Hinge-Dixie Limb discoveries, caught the market’s attention;
within 18 months, Great Bear’s stock catapulted 2,000%.
Conclusion
I firmly believe that 2019 has been a pivotal year for junior mining.
Coming out of 2018’s slump in several commodities, due mostly to the
uncertainty associated with the US-China trade war, this year we saw
very strong performances from gold, silver, copper, palladium, nickel
and zinc – having correctly predicted price corrections for each.
While it’s disappointing not to see a rising tide of junior miner
stock prices to accompany these bullish calls, we continue to believe.
After all, we want to own the cheapest most in demand metals we can
find to reap the maximum coming rewards. That means buying it while it’s
still in the ground.
The fact is junior resource companies – the owners of the world’s
future mines – are on sale. If you like their management teams, their
projects and their plans for 2020, perhaps now is the time to be
acquiring a position.
Posted by AGORACOM
at 10:22 AM on Tuesday, January 7th, 2020
Sponsor: Loncor is a Canadian gold exploration company focused on two projects in the DRC – the Ngayu and North Kivu projects, both have historic gold production. Exploration at the Ngayu project is currently being undertaken by Loncor’s joint venture partner Barrick Gold. The Ngayu project is 200km southwest of the Kibali gold mine, operated by Barrick, which produced 800,000 ounces of gold in 2018. Barrick manages and funds exploration at the Ngayu project until the completion of a pre-feasibility study on any gold discovery meeting the investment criteria of Barrick. Click Here for More Info
Recent strong price gains are a bullish upside technical ‘breakout’ from recent trading levels, to suggest still more price gains are very likely in the coming weeks and months, or longer
Bullion’s price has benefited from heightened political tensions but also has enjoyed softness in the dollar,
Gold futures on Monday marked their highest settlement since April of 2013, as the killing last week of a top Iranian military commander, Qassem Soleimani, reverberated through financial markets, momentarily upending appetite for assets considered risky and boosting traditional haven assets like gold.
February gold GCG20, +0.23%
on Comex added $16.40, a gain of 1.1%, to settle at $1,568.80 an
ounce, after it briefly touched $1,590.90 in intraday action. The most
active contract saw its highest settlement since April 9, 2013,
according to FactSet data. Gold also rose for a ninth consecutive
session, its longest period of straight gains since an 11-day streak
that ran from December 2018 to January 2019.
March silver SIH20, +0.28%
edged up by 2.8 cents, or 0.2%, to finish at $18.179 an ounce, pulling
back from a high of $18.55, which was the highest intraday level since
late September.
Last week, the most-active gold contract gained 2.3%, its second week
of gains, while silver prices added 1.1%, also landing it higher for
two consecutive weeks.
“History shows that a big spike up in prices amid higher volatility
tends to produce near-term market tops sooner rather than later, after
that initial spike up,†said Jim Wyckoff, senior analyst at Kitco.com.
“That means in the coming days the gold market could put in a
‘near-term’ top that will last for a moderate period of time.â€
“However, for the longer-term investors in gold, it’s important to
note that the recent strong price gains are a bullish upside technical
‘breakout’ from recent trading levels, to suggest still more price gains
are very likely in the coming weeks and months, or longer,†he said in
daily commentary.
On Sunday, the Iraqi parliament passed a nonbinding resolution to
expel American troops in the wake of the U.S. drone strike that killed
Soleimani, leader of the foreign wing of Iran’s Islamic Revolutionary
Guard Corps, on Iraqi soil.
That act has intensified tensions in the Middle East, boosting the
appeal of assets considered safe during global political conflicts.
Trump has threatened harsh sanctions against
Iraq if it expels U.S. troops, and doubled down on earlier comments
threatening to target Iranian cultural sites if Iran strikes back. Iran has said it would no longer honor the 2015 nuclear deal with a group of world powers, which the U.S. backed out of in 2018.
Meanwhile, the benchmark 10-year Treasury yield TMUBMUSD10Y, +0.24% was up at 1.7917%, after tapping a four-week low on Friday after the Iranian military leader’s killing.
Bullion’s price has benefited from heightened political tensions but
also has enjoyed softness in the dollar, which has occurred as investors
shift to Swiss franc USDCHF, +0.3719% and Japanese yen USDJPY, +0.09% amid the potential for political turmoil.
The U.S. ICE Dollar Index DXY, +0.33%,
a measure of the buck against a half-dozen currencies, was down 0.2% at
96.661 and has posted weekly declines in the last two weeks.
A weaker buck can make gold more attractive to buyers using other
currencies, and lower bond yields can also help boost the comparative
appeal of gold against government debt.
“Gold continues its breakout higher as it is now at the highest level
since April 2013,†wrote Peter Boockvar, chief investment officer at
Bleakley Advisory Group, in a Monday research report.
“I remain bullish but caution not to buy it on geopolitical concerns
because as stated they are usually temporary. Buy it instead because the
dollar continues to weaken and real yields continue to fall,†he said.
Among other metals, March copper HGH20, -0.11% added 0.1% to $2.79 a pound. April PLJ20, -0.34% shed 2.4% to $966.20 an ounce, but March palladium PAH20, +0.87%
added 1.7% to $1,989.60 an ounce. Palladium futures notched a record
high, as they’ve done each day so far this year and many times
throughout 2019.
The platinum group markets are “not concerned that recent geopolitical events could derail the global economy and therefore demand for auto catalysts,†analysts at Zaner Metals, wrote in daily note. “Instead, it is apparent that platinum and palladium are being considered as safe haven instruments, with classic physical market fundamentals being pushed to the sidelines.”
Posted by AGORACOM
at 3:32 PM on Monday, December 9th, 2019
Sponsor: Loncor is a Canadian gold exploration company focused on two projects in the DRC – the Ngayu and North Kivu projects. Both projects have historic gold production. Exploration at the Ngayu project is currently being undertaken by Loncor’s joint venture partner Barrick Gold. The Ngayu project is 200km southwest of the Kibali gold mine, operated by Barrick, which produced 800,000 ounces of gold in 2018. Barrick manages and funds exploration at the Ngayu project until the completion of a pre-feasibility study on any gold discovery meeting the investment criteria of Barrick. Click Here for More Info
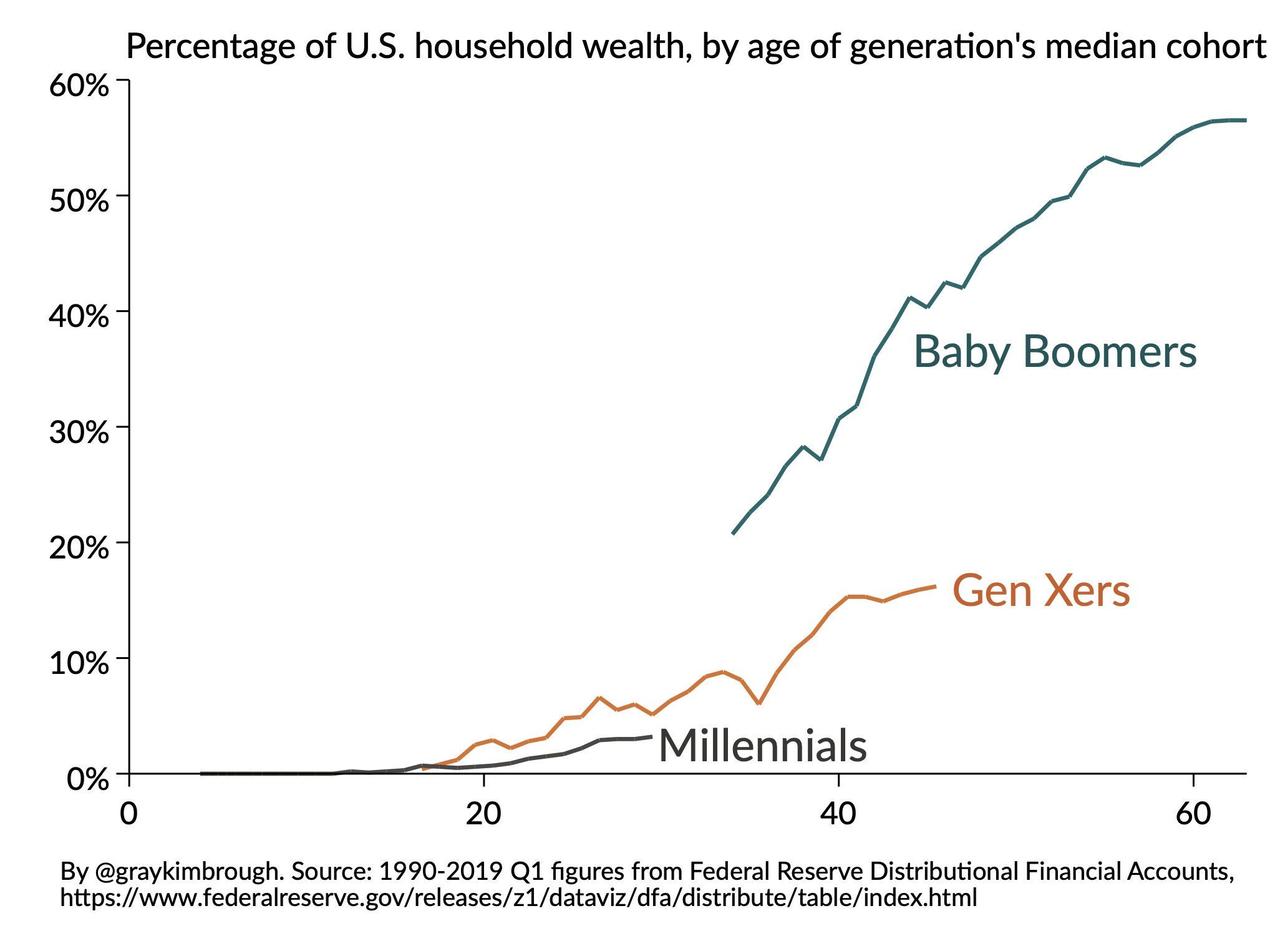
Millennials’ willingness to accept ever-increasing central-planning means gold is the go-to asset to preserve wealth over long-term horizons
Goldman keeps its 3,6 and 12m forecasts at $1,600toz.
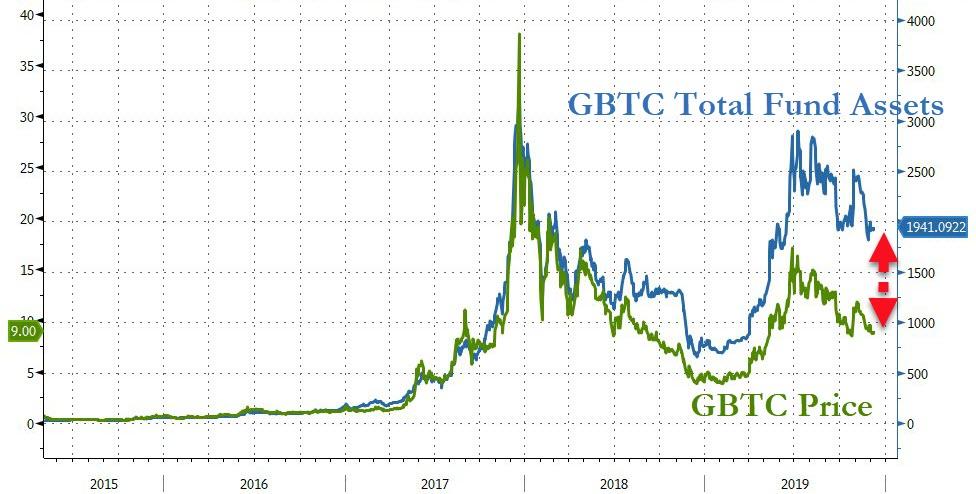
“Drop Gold” – the ever-present tagline of Grayscale’s Bitcoin Trust TV commercial – appears to be working its magic on a certain cohort of society.
https://youtu.be/x6B6cj1CIMk
2019 has seen assets under management in GBTC soar…
Source: Bloomberg
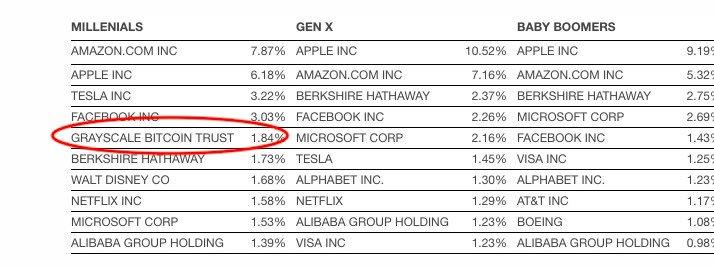
And for Millennials, according to the latest data from Charles Schwab, the
Grayscale Bitcoin Trusts is the 5th largest holding in retirement
accounts (including 401(k)s) with almost 2% of their assets tied to the success (or failure) of the largest cryptocurrency.
For now this remains a relatively small number…
But, given the increasing acceptance of socialist policies, and the
historically-ignorant promise of MMT (and don’t forget UBI), Goldman
Sachs suggests that Millennials’ willingness to accept ever-increasing
central-planning means gold is the go-to asset to preserve wealth over
long-term horizons.
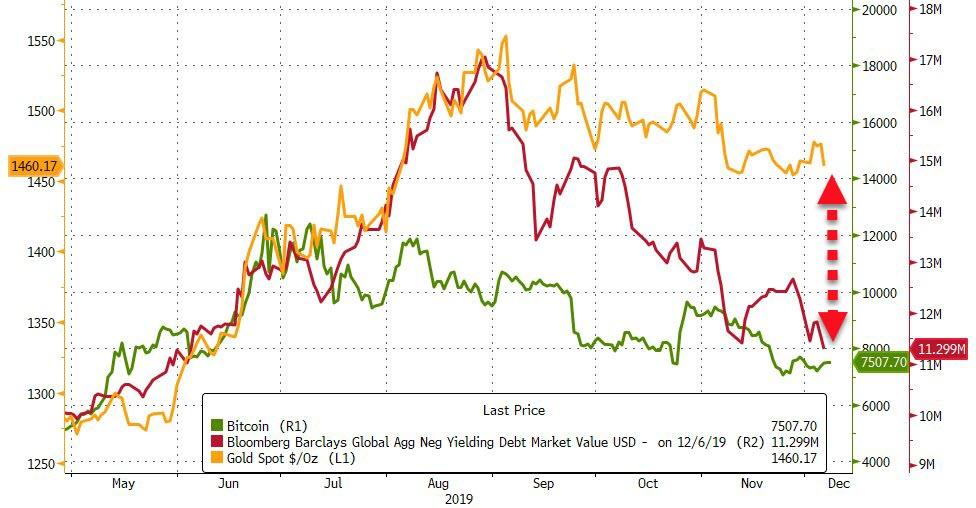
And, at least in the short-term, gold has held its value (relative to
Bitcoin) as the world’s volume of negative-yielding assets has shrunk
on the latest round of optimism that ‘this time is different’…
Source: Bloomberg
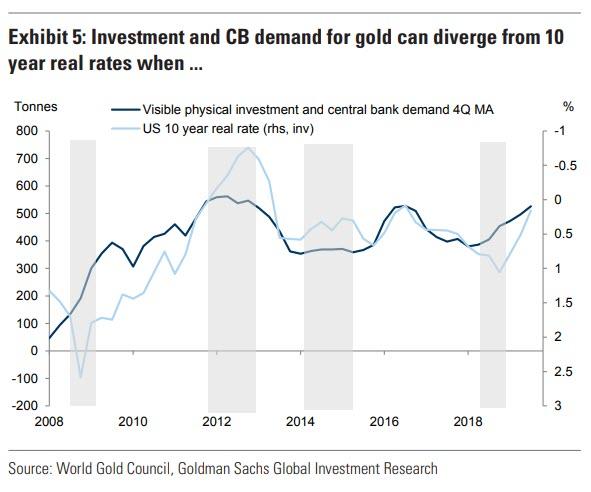
Indeed, Goldman notes that gold looks attractive particularly relative to DM bonds. Both
bonds and gold are defensive assets which go up in value when fear
spikes. Exhibit 5 shows that investment and central bank demand for gold
has been highly correlated with US 10 year real rates.
During the next recession gold may offer better
diversification value to bonds because the latter may be capped by the
lower bound in rates limiting their ability to appreciate materially.
This is particularly relevant for Europe where rates are already close
to the lower bound. This means that during the next recession when fear
spikes, gold may decouple from rates and outperform them.
Specifically, Goldman says that Gold is a particularly good diversifier for investors with long term investment horizon.
If we look at week on week changes in gold they tend to be dominated
by the dollar. As a result the gold S&P500 weekly changes
correlation looks almost identical to correlation of S&P 500 and the
dollar (see Exhibit 7).
However, if we look at 5 year returns gold and S&P 500 display
strong inverse relationship with gold performing great during the
1970ies and 2000s when the S&P 500 underperformed (see Exhibit 8).
This makes sense given that gold is ultimately a hedge
against systematic macro risks, which can lead to long periods of equity
underperformance. Our strategy team also finds that gold
historically has been a good hedge against periods of large drawdowns of
the 60/40 portfolio. This was particularly true when a drawdown is
caused by accelerating inflation as it was in the 1970ies. Therefore,
if one is concerned that the low macro volatility of 2010s will be
followed by higher volatility in the 2020s, which would hurt equities,
gold would be a good addition to the portfolio.
Geopolitical uncertainty is already translating into greater gold demand.
CBs globally have been buying gold at a very strong pace, albeit more
recently the rate of CB purchases has cooled off as China and Russia
have moderated their buying. Nevertheless, 2019 still looks to be a
record year for CB gold purchases with our target of 750 tonnes combined
purchases likely to be met (see Exhibit 15).
Rising political risk – together with negative European rates
– may be an important reason behind the large share of unaccounted gold
investment over the past several years.
Exhibit 17 shows cumulative unexplained gold demand based on World Gold Council (post 2010) and GFMS (pre 2010) balances data. It surged since 2016. Similar dynamics can be seen when we look at implied vaulted gold stocks built in the UK and Switzerland, which is calculated as implied cumulative total net imports minus transparent ETF gold stocks. In fact, since the end of 2016 the implied build in non-transparent gold investment has been much larger than the build in visible gold ETFs. This is consistent with reports that vault demand globally is surging.
Political risks, in our view, help explain this because if an
individual is trying to minimize the risks of sanctions or wealth taxes,
then buying physical gold bars and storing them in a vault, where it is
more difficult for governments to reach them, makes sense. Finally,
this build can also reflect hedges by global high net worth individuals
against tail economic and political risk scenarios in which
they do not want to have any financial entity intermediating their gold
positions due to the counterparty credit risk involved.
Finally, Modern Monetary Theory (MMT) – which advocates for
central bank financed fiscal deficits – has been gaining more airtime
recently, with former Fed Chair Ben Bernanke and former Fed
Vice Chair Stanley Fischer offering similar proposals. The logic is that
persistent low inflation and lack of borrowing capacity in many
developed markets means that direct CB financing of government deficit
is warranted. This is especially true for countries where monetary
policy is close to the limits of its capacity. Whilst there are arguments to be made in favor of MMT there are also risks associated with it. Notably some economists stress that if not used responsibly it could lead to a material acceleration in inflation.
In the next recession, our US economists do not expect governments to
adopt direct monetary financing and expect inflation to remain firmly
anchored. But this doesn’t necessarily prevent an increase in
debasement concerns if conversations around MMT become more widespread —
a potential boost to demand for gold as a debasement hedge.
False debasement concerns have led to gold rallies in the past. Post
2008 aggressive QE in the US led to a considerable push into inflation
protected assets including gold (see Exhibit 19). These inflationary
concerns did not materialise and the allocation to gold and inflation
protected bonds fell sharply in 2013. Another period, currently is less
talked about, is the Great Depression when the Fed pumped a lot of money
into the economy leading to debasement concerns (see Exhibit 20). What
followed was actually disinflation and the gold price eventually
moderated.
Overall, while Goldman acknowledges the risks related to
still high gold positions we believe the strategic case is still strong,
particularly for investors with long term horizons.
This is based on a deteriorated attractiveness of long term DM bonds
as portfolio diversifiers and real return generation instruments,
exposure to growing EM wealth, limited mine supply growth, elevated
political risks and a potential increase in debasement concerns sparked
by rising airtime of Modern Monetary Theory.
As such Goldman keeps its 3,6 and 12m forecasts at $1,600toz.
So – will Millennials keep saying “bye gold” or come over the ‘dark side’ and “buy gold”?