Posted by AGORACOM
at 11:48 AM on Tuesday, August 4th, 2020
SPONSOR: Candente Gold is creating a growth strategy encompassing its Mexican assets to build a cash flowing business. Recent acquisition of the SDA Plant and the El Dorado Historic Mines is the first step. Their growth strategy is to build a cash flowing business platform and gain access to properties with near surface exploration potential while maintaining El Oro as its flagship asset, and an integral part of the overall growth strategy. El Oro is a district scale gold project encompassing a well-known prolific high-grade gold-silver epithermal vein system in Mexico that has several undeveloped veins and has tremendous exploration potential. Click Here for More Info
LONDON (Reuters) – Gold’s rally has halted just below $2,000 an ounce partly due to fierce technical resistance, but an eventual break above that level is likely, freeing prices for more record highs, technical analysts said.
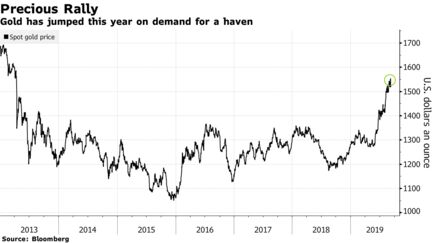
The gold price XAU= has surged 30% this year to an all-time peak around $1,975 an ounce and is one of 2020’s best-performing assets.
The rally was driven by a belief that gold will hold its value better than other assets as fallout from COVID-19 ripples through the global economy.
Central bank stimulus has pushed inflation-adjusted U.S. bond yields to record lows, making non-yielding gold more attractive, and the dollar has weakened sharply, making bullion cheaper for buyers with other currencies.
The never-before-reached $2,000-an-ounce mark is a major psychological resistance level, with gold’s 49-year trend channel resting just below it at $1,983, said Commerzbank technical analyst Karen Jones.
Only an end-of-month or, better yet, end-of-quarter close above these levels will signal a break from the channel, she said.
“Tighten your stops … unless the top of my range is taken out in a convincing manner … upside from here is marginal.”
Technical analysts seek patterns and signals in price charts which allow them to predict and interpret moves. Traders and automated trading systems also take prompts from technical signals.
Because gold’s rally has been so fast, a downward correction is likely and could be brutal, analysts said, before the market attempts another stab higher.
Early support is coming in around its 20-day moving average, at $1,875, and the bottom of its 4-month uptrend, around $1,830.
Below that is more powerful support at the 20-week moving average, currently at $1,755, said Tom Pelc, an independent technical analyst formerly at Nomura and RBS.
Such a fall wouldn’t necessarily doom the longer-term uptrend.
“We continue to see this improving volatility backdrop, so there’s no sign that the long-term trend is changing,” said Richard Adcock, a former UBS and now independent technical analyst.
“The market can carry on higher than people expect,” he said.
If resistance is broken, Fibonacci extensions offer short-term targets. These are based on the idea that a rally will extend in predictable proportions extrapolated from a previous rally. One is at $2,067, said Pelc, another comes in at $2,286.
That could only be the beginning of a multi-year move. Lucas ratios — a tool using a sequence of numbers similar to Fibonacci’s — suggest gold could rise to $3,598.80 an ounce in 4-5 years, said Pelc.
Reporting by Peter Hobson; Editing by Veronica Brown and Emelia Sithole-Matarise
Posted by AGORACOM
at 1:25 PM on Friday, June 12th, 2020
SPONSOR: Lomiko Metals is focused on the exploration and development of minerals for the new green economy such as lithium and graphite. Lomiko has an option for 100% of the high-grade La Loutre graphite Property, Lac Des Iles Graphite Property and the 100% owned Quatre Milles Graphite Property. Lomiko is uniquely poised to supply the growing EV battery market. Click Here For More Information
These trials will help steer business investment decisions in future years
The benefits from trials so far include:
Health and safety improvements for employees underground: EVs are much quieter than diesel vehicles and produce less heat and zero exhaust emissions. “From an operator comfort perspective, EVs are certainly an improvement,â€
Cost savings: EVs can reduce underground ventilation demands and the associated operating and capital expenditure
Environmental benefits: EVs contribute to the reduction of greenhouse gas emissions.
By the end of 2020, Vale hopes to have upward of 20 battery-powered vehicles operating within its North Atlantic operations, according to Alex Mulloy, Mining Engineer within Vale’s Base Metals Technology and Innovation division.
The plan is for the electric vehicles (EVs) to be operating on a trial basis at its Creighton, Coleman, Copper Cliff, Garson and Thompson mines by the end of the year, with the company having already made significant headway on achieving this goal.
Mulloy said the green vehicles are going to be evaluated with feedback from operations, as well as operating data, to help Vale understand how they perform in terms of reliability, functionality and the benefits they can offer our people and the business.
The benefits from trials so far include:
Health and safety improvements for our employees underground: EVs are much quieter than diesel vehicles and produce less heat and zero exhaust emissions. “From an operator comfort perspective, EVs are certainly an improvement,†Mulloy said;
Cost savings: EVs can reduce underground ventilation demands and the associated operating and capital expenditure; and
Environmental benefits: EVs contribute to the reduction of greenhouse gas emissions.
“EVs certainly complement the efforts of the business in terms of greenhouse gas and carbon reduction,†Mulloy said. “It’s a great technology. Not only does it enable operational benefit and improvement, it also contributes to our greater goals of reducing our emissions and the impact on the environment.â€
Natalie Kari, Principal Engineer, Strategic Electric Vehicle Implementation, said: “Exhaust emissions from diesel engines are one of the larger contributors to environmental pollution. EVs are an opportunity to increase safety by improving operating conditions and creating a safe work environment. Reducing noise, vibrations, heat, greenhouse gas emissions, and diesel particulate matter, while improving air quality, contributes to creating an attractive work environment for top talent.
“With increased challenging mine conditions at depth, EVs also provide an opportunity to sustain productivity by enabling mines to produce in areas that otherwise may not be feasible without these benefits, contributing towards mining for years to come.â€
These trials will help steer business investment decisions in future years, according to Mulloy.
“Over the coming months, a number of large prime mover vehicles will be delivered,†he said. “When those vehicles arrive, it will be an exciting step in the journey because most of the question marks around the performance of EVs relate to the large vehicles, so that’ll be a chance for us to really put this technology to the test.â€
Kari added: “Our company’s next major steps include collaborating with internal and external industry stakeholders towards safe implementation, comprehensive trial data collection and validation of a robust model towards a final approved five-year implementation strategy. With any new technology, investment in our people will be a priority to ensure they are equipped with the tools necessary for successful operation and maintenance.
“It is thrilling to be a part of leading this effort in a time of increased innovation and environmental awareness,†she continued. “The movement from traditional diesel to electric vehicle brings a feeling of social pride in creating a healthier workplace.â€
Posted by AGORACOM-JC
at 4:32 PM on Friday, February 28th, 2020
AGORACOM Clients Attending PDAC 2020
THEREGAL PROJECT
B.C.’s Next Premier
Silver, Lead, Zinc, Copper Deposit?
Affinity Metals holds under option, a 100% interest in the Project, located within the northern end of the prolific Kootenay Arc, a highly prospective mineralized trend.
Treaty Creeks’ GOLDSTORM zone hosts a conceptual volume of ONE BILLION TONNES rock grading close to one gram per tonne gold and is open to the north, east, and at depth. Â
A major drill program is being planned for spring to develop a resource calculation. The focus has been on the gold enriched Goldstorm Zone which is on trend with, and part of, the same geological system as Seabridge Gold’s neighboring KSM deposits.
American Creek been selected to do a formal presentation at the conference. The presentation will be held on Tuesday, March 5 at 2:00PM in room #802
HPQ Silicon Resources designs, develops, manufactures and commercializes plasma base processes
The innovative PUREVAP “Quartz Reduction Reactors†(QRR), will permit the One Step transformation of Quartz (SiO2) into High Purity Silicon (Si) at prices that will promote considerable renewable energy potential.
Lomiko hosts high-grade graphite at its La Loutre Property in Quebec. The company is working toward a Pre-Economic Assessment (PEA) that will increase its current indicated resource of 4.1 Mt of 6.5% Cg to over 10 Mt of 10%+ Cg in order to supply and develop graphite materials for the green economy.
Posted by AGORACOM-JC
at 9:36 AM on Wednesday, October 23rd, 2019
When the Wall Street Journal calls your Gold Report “The Gold Standard Of Gold Research”, it is safe to say you are a global influencer and expert in all things gold.
This is Ronnie Stoeferle, whose “In Gold We Trust” report has also been downloaded 1.8 million times in English, German and Mandarin in case anyone had any doubt as to his expertise.
Today, Ronnie became the founding member of the Affinity Metals (AFF:TSXV) Advisory Board, which implies that we can expect others to be appointed as well. Why would Ronnie join a company with a market cap under $5,000,000? You’ll have to watch the interview to find out … but here are a couple of hints:
1. Affinity Metals flagship project, the Regal, has reported HISTORICAL reserves of 590,703 tonnes grading 71.6 grams per tonne silver, 2.66 per cent lead, 1.26 per cent zinc, 1.1 per cent copper, 0.13 per cent tin and 0.015 per cent tungsten. These were prepated prior to 43-101 standards and should not be relied upon until they are brought into compliance with 43-101 standards.
2. A Technical Report, which was prepared in 1971 using a silver price of $1.75 per troy ounce, makes a positive recommendation for production, including the establishment of a 500 ton per day concentrator with a 400 ton per day silver, lead and zinc circuit and a 100 ton per day tin, tungsten and copper circuit.
These are just 2 factors that led Ronnie to declare that Affnity Metals is “one of the largest investments in my private portfolio”.
Grab your favourite beverage, kick back and watch this great interview with both Ronnie and Affinity CEO, Rob Edwards.
Posted by AGORACOM
at 10:10 AM on Thursday, October 10th, 2019
Previous drilling found a network of veins with widespread gold and silver mineralization.
The first phase geophysical survey revealed a large chargeability anomaly right below these veins.
The anomaly is quite large, allowing AAX to expand the grid to the south with fewer lines so we expect to complete this survey within 2 weeks and then begin drilling
12 miles to the west is the San Nicolas VMS mine owned by Teck Corporation and 12 miles to the south is the El Coronel open pit gold mine located in the same geological environment as the Tabasquena project.
Kamloops, British Columbia–(Newsfile Corp. – October 10, 2019) – Advance Gold Corp. (TSXV: AAX) (“Advance Gold” or “the Company”) is
pleased to announce that the second phase of geophysics is underway on
the Company’s Tabasquena project in Zacatecas, Mexico. The goal of this
second 3D induced polarization (IP) survey is to expand the grid
completed in the first phase to the south where the anomaly comes
closest to surface.
The
first phase survey identified a large continuous chargeability anomaly
just below an area of widespread gold and silver mineralization in
epithermal veins. The anomaly is approximately 250 metres wide and 800
metres long from north to south. The second phase IP survey will extend
the grid approximately 1000 metres to the south where due to the
elevation change the anomaly is closest to surface. The chargeability
anomaly remains open to the north, south and at depth.
An
IP survey is a geophysical imaging technique used to identify the
electrical chargeability of subsurface materials such as ore. The
technique involves the measurement of the slow decay of voltage in the
ground following the cessation of an excitation current. The method
makes use of the capacitive action of the subsurface to locate zones
where chargeable minerals are present. Disseminated sulphides and other
chargeable minerals have distinct IP signatures.
It is important to note that approximately 12 miles to the west is the San Nicolas VMS mine owned by Teck Corporation and 12 miles to the south is the El Coronel open pit gold mine located in the same geological environment as the Tabasquena project.
Allan Barry Laboucan, President and CEO of Advance Gold Corp. commented: “It’s
a very exciting time for Advance Gold, previous drilling found a
network of veins with widespread gold and silver mineralization.
Following this the first phase geophysical survey revealed a large
chargeability anomaly right below these veins. Another impressive aspect
of the first IP survey is that as we move to the south there is a
decrease in the depth to the IP anomaly that would indicate that the
anomaly is getting nearer to the surface as we move to the south. A
possible reason for this is that the elevation decreases as we go
southward, so it is important for us to extend the IP grid to the south
before we drill test the IP anomaly. In our recent news release
announcing the addition of our geophysical advisor, he described the
anomaly as ‘quite remarkable in its size and continuity.’ As the anomaly
is quite large, we are able to expand the grid to the south with fewer
lines so we expect to complete this survey within 2 weeks and then begin
drilling. We are in a region with very large mines, including El
Coronel which is an open pit mine in production since 2008 which is 12
miles to the south of Tabasquena. Our team looks forward to further
advancing the Tabasquena project with the second phase of geophysics and
upcoming drilling.”
Julio
Pinto Linares is a QP, Doctor in Geological Sciences with specialty in
Economic Geology and Qualified Professional No. 01365 by MMSA., and QP
for Advance Gold and is the qualified person as defined by National
Instrument 43-101 and he has read and approved the accuracy of technical
information contained in this news release.
About Advance Gold Corp. (AAX.V)
Advance
Gold is a TSX-V listed junior exploration company focused on acquiring
and exploring mineral properties containing precious metals. The Company
acquired a 100% interest in the Tabasquena Silver Mine in Zacatecas,
Mexico in 2017, and the Venaditas project, also in Zacatecas state, in
April 2018.
The
Tabasquena project is located near the Milagros silver mine near the
city of Ojocaliente, Mexico. Benefits at Tabasquena include road access
to the claims, power to the claims, a 100-metre underground shaft and
underground workings, plus it is a fully permitted mine.
Venaditas
is well located adjacent to Teck’s San Nicolas mine, a VMS deposit, and
it is approximately 11km to the east of the Tabasquena project, along a
paved road.
In
addition, Advance Gold holds a 13.23% interest on strategic claims in
the Liranda Corridor in Kenya, East Africa. The remaining 86.77% of the
Kakamega project is held by Barrick Gold Corporation.
For further information, please contact:
Allan Barry Laboucan, President and CEO Phone (604) 505-4753 www.advancegold.ca
Posted by AGORACOM
at 1:52 PM on Thursday, October 3rd, 2019
SPONSOR: Advance Gold AAX.v – Advance Gold controls 100% interest in the Tabasquena Silver Mine in Zacatecas, Mexico. A cluster of 30 Epithermal veins have been discovered, with recent emphasis on exploring a large anomaly to drill. Advance also owns 15% of the Kakamega JV attached to Barrick Takeover Offer for Acacia Mining. Click Here For More Info
Recession fears are once again gripping financial markets and
pushing gold prices higher as sentiment within the U.S. service sector
fell more than expected, according to the latest data from the
Institute for Supply Management (ISM).
Thursday, the ISM said its nonmanufacturing index showed a reading
of 52.6% for September, down from August’s reading of 56.4%. The data
was much weaker than expected as consensus forecasts were calling for a
reading of 55.1%.
According to reports this is the lowest reading in three years.
Readings above 50% in such diffusion indexes are seen as a sign of
economic growth, and vice-versa. The farther an indicator is above or
below 50%, the greater or smaller the rate of change.
Ahead of the report, the gold market was holding its own above
$1,500 an ounce, recovering from a 2% selloff at the start of the week.
The latest economic data has added to gold’s gains. December gold
futures last traded at $1,518.80 an ounce, up 0.72% on the day.
Economists and analysts warned that disappointing service sector
data could boost recession fears as this is the largest component of
the U.S. economy.
The nonmanufacturing data comes just two days after the ISM said
that its manufacturing index fell even further into contraction
territory, also missing economist expectations.
“The non-manufacturing sector pulled back after reflecting strong
growth in August. The respondents are mostly concerned about tariffs,
labor resources and the direction of the economy,†said Anthony Nieves,
chair of the ISM Non-Manufacturing Business Survey Committee.
Looking at the components of the report, the Business Activity Index
dropped to a reading of 55.2%, down from August’s level of 61.5%.
The labor market also lost some momentum in September, with the
Employment Index falling to 50.4%, down from August’s level of 53.1%.
This indicator is closely watched by economists as it is used as a
predictor for Friday’s nonfarm employment report.
Some economists have noted that the miss in the ISM employment data points to downside risk to Friday’s employment report.
Posted by AGORACOM
at 9:19 AM on Wednesday, September 18th, 2019
Kamloops, British Columbia–(Newsfile Corp. – September 18, 2019) –
Advance Gold Corp. (TSXV: AAX) (“Advance Gold” or “the Company”) is
pleased to provide an exploration update on its Tabasquena gold and
silver project in Zacatecas, Mexico. To date, 10 drill holes have been
completed hitting widespread gold and silver mineralization in near
surface epithermal veins. Recently, a 3D induced polarization (IP)
survey was completed that identified a significant continuous
chargeability anomaly, with an east-west width of approximately 250
metres and an apparent strike length of over 800 metres. This anomaly is
located directly below the Tabasquena vein. The anomaly remains open
to the north and to the south and at depth. A second phase 3D IP
geophysical survey is scheduled to begin in the first week of October to
extend the grid to the south.
The purpose of the extended grid to
the south will be threefold, firstly it will establish the continuity
of the anomaly to the south, secondly whether or not the target anomaly
becomes shallower and lastly it will assist in positioning the upcoming
drill hole locations. It is planned to commence drilling once the IP
survey has been completed.
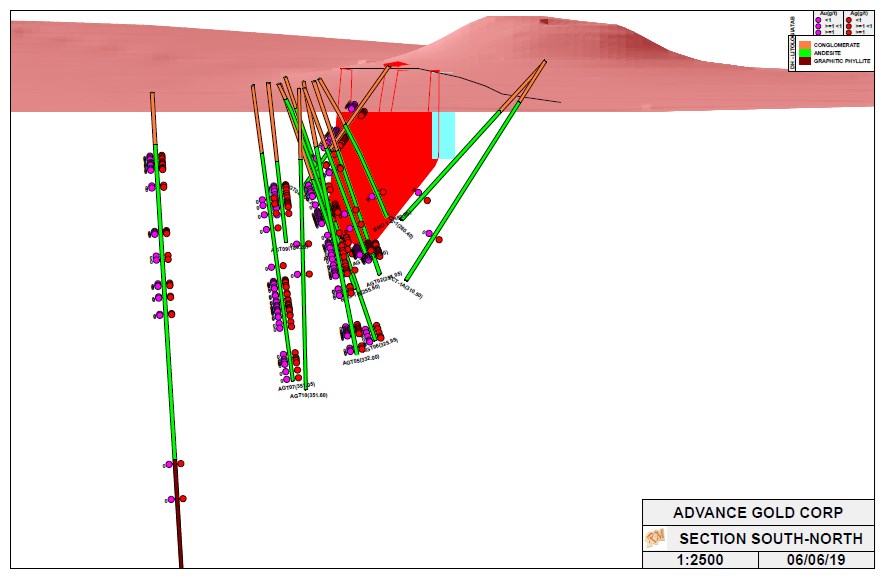
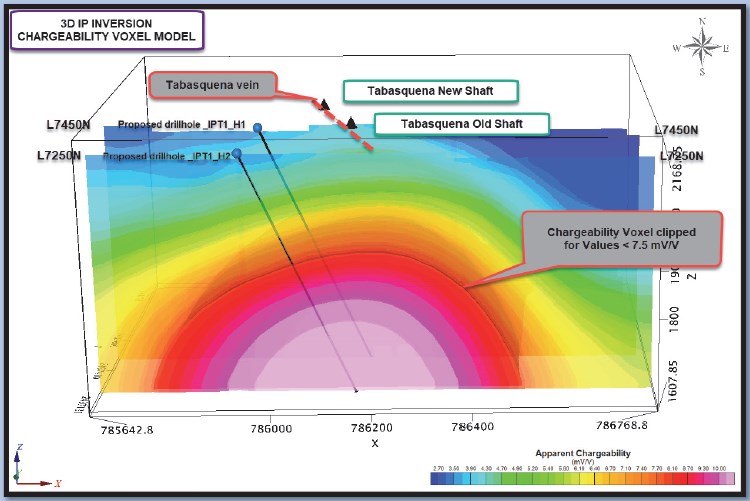
Images shown below are a 3D model of
the epithermal veins hit in previous drilling and a voxel inversion
model showing the extent of the large chargeability anomaly for lines
L7450N and L7250N. These two diagrams are an excellent representation of
the emerging targets at Tabasquena.
The black line at the surface
of the 3D model of drill holes is the surface projection of the
Tabasquena vein. The red shaded area is the historical mining done by
Penoles. The chargeability anomaly is approximately 250 metres below the
historical mining, and it follows the strike direction of the
Tabasquena vein. The epithermal veins, with highlighted widespread gold
and silver mineralization, are above and slightly to the west of the
deeper chargeability anomaly.
Allan Barry Laboucan, President and CEO of Advance Gold Corp., commented: “Our
exploration efforts at Tabasquena are coming together nicely with the
past drilling and the recent IP geophysical survey. It is important to
point out, the IP survey is meant to reveal sulphides through
chargeability. The epithermal veins are low sulphidation and relatively
small and don’t show up well in the IP survey, however right below these
veins is the large continuous chargeability anomaly of over 800 metres
from north to south and approximately 250 metres from east to west.
Before starting our next round of drilling, we wanted to extend the IP
grid to the south, where the anomaly is closer to surface. There is a
significant elevation change of approximately 300 metres from the
northernmost line of the geophysical survey to the most southerly one.
We have approximately 1500 metres to the southern limits of our claims.
The chargeability anomaly is open to the north, but due to the higher
elevation and more cover it exceeds the depth limits of the IP survey.
We are very excited to extend the grid to the south as that is the
direction of the highest intensity of the chargeability and where it
becomes closest to surface. The combination of the quality of Tabasquena
and our various projects, our low share count and a tight share
structure, with substantial insider ownership and tiny valuation, puts
us in a unique position relative to our exploration focused peers as the
market for gold and silver are gaining strength.”
Julio Pinto
Linares is a QP, Doctor in Geological Sciences with specialty in
Economic Geology and Qualified Professional No. 01365 by MMSA., and QP
for Advance Gold and is the qualified person as defined by National
Instrument 43-101 and he has read and approved the accuracy of technical
information contained in this news release.
About Advance Gold Corp. (AAX.V)
Advance
Gold is a TSX-V listed junior exploration company focused on acquiring
and exploring mineral properties containing precious metals. The Company
acquired a 100% interest in the Tabasquena Silver Mine in Zacatecas,
Mexico in 2017, and the Venaditas project, also in Zacatecas state, in
April, 2018.
The Tabasquena project is located near the Milagros
silver mine near the city of Ojocaliente, Mexico. Benefits at Tabasquena
include road access to the claims, power to the claims, a 100-metre
underground shaft and underground workings, plus it is a fully permitted
mine.
Venaditas is well located adjacent to Teck’s San Nicolas
mine, a VMS deposit, and it is approximately 11km to the east of the
Tabasquena project, along a paved road.
In addition, Advance Gold
holds a 13.23% interest on strategic claims in the Liranda Corridor in
Kenya, East Africa. The remaining 86.77% of the Kakamega project is held
by Barrick Gold Corporation.
Posted by AGORACOM
at 2:11 PM on Thursday, September 12th, 2019
SPONSOR: Advance Gold AAX.v – Advance Gold controls 100% interest in the Tabasquena Silver Mine in Zacatecas, Mexico. A cluster of 30 Epithermal veins have been discovered, with recent emphasis on exploring a large anomaly to drill. Advance also owns 15% of the Kakamega JV attached to Barrick Takeover Offer for Acacia Mining. Click Here For More Info
Diversify Well To Protect Oneself Against The Coming ‘Paradigm Shift’
The most important forces that now exist are:
1) The End of the Long-Term Debt Cycle (When Central Banks Are No Longer Effective) +
2) The Large Wealth Gap and Political Polarity +
3) A Rising World Power Challenging an Existing World Power = The Bond Blow-Off, Rising Gold Prices, and the Late 1930s Analogue
In other words now 1) central banks have limited ability to stimulate, 2) there is large wealth and political polarity and 3) there is a conflict between China as a rising power and the US as an existing world power.
If/when
there is an economic downturn, that will produce serious problems in
ways that are analogous to the ways that the confluence of those three
influences produced serious problems in the late 1930s.
Before I get into the meat of what I hope to convey, I will repeat my
simple timeless and universal template for understanding and
anticipating what is happening in the economy and markets.
My Template
There are four important influences that drive economies and markets:
Productivity
The short-term debt/business cycle
The long-term debt cycle
Politics (within countries and between countries).
There are three equilibriums:
Debt growth is in line with the income growth required to service the debt,
The economy’s operating rate is neither too high (because that will
produce unacceptable inflation and inefficiencies) nor too low (because
economically depressed levels of activity will produce unacceptable pain
and political changes), and
The projected returns of cash are below the projected returns of
bonds, which are below the projected returns of equities and the
projected returns of other “risky assets.â€
And there are two levers that the government has to try to bring things into equilibrium:
Monetary policy
Fiscal policy
The equilibriums move around in relation to each other to produce
changes in each like a perpetual motion machine, simultaneously trying
to find their equilibrium level. When there are big deviations from one
or more of the equilibriums, the forces and policy levers react in ways
that one can pretty much expect in order to move them toward their
equilibriums.
For example, when growth and inflation fall to lower than the desired
equilibrium levels, central banks will ease monetary policies which
lowers the short-term interest rate relative to expected bond returns,
expected returns on equities, and expected inflation. Expected bond
returns, equity returns, and inflation themselves change in response to
changes in expected conditions (e.g. if expected growth is falling, bond
yields will fall and stock prices will fall).
These price changes happen until debt and spending growth pick up to
shift growth and inflation back toward inflation. And of course all this
affects politics (because political changes will happen if the
equilibriums get too far out of line), which affects fiscal and monetary
policy. More simply and most importantly said, the central bank has the
stimulant which can be injected or withdrawn and cause these things to
change most quickly.
Fiscal policy, which changes taxes and spending in politically
motivated ways, can also be changed to be more stimulative or less
stimulative in response to what is needed but that happens in lagging
and highly inefficient ways.
For a simpler explanation of this template see my 30-minute animated video “How the Economic Machine Works†and for a more comprehensive explanation see my book Understanding the Principles of Big Debt Crises, which is available free as a PDF here or in print on Amazon. Also, to learn more about our extensive debt cycle research, please visit our debt crises research library on Bridgewater.com.
Looking at What Is Happening Now in the Context of That Template
Regarding the above template and where we are now, in my opinion, the most important things that are happening (which last happened in the late 1930s) are
a) we are approaching the ends of both the short-term and long-term
debt cycles in the world’s three major reserve currencies, while
b) the debt and non-debt obligations (e.g. healthcare and
pensions) that are coming at us are larger than the incomes that are
required to fund them,
c) large wealth and political gaps are producing political conflicts
within countries that are characterized by larger and more extreme
levels of internal conflicts between the rich and the poor and between
capitalists and socialists,
d) external politics is driven by the rising of an emerging power
(China) to challenge the existing world power (the US), which is leading
to a more extreme external conflict and will eventually lead to a
change in the world order, and [Ian Bremmer calls this the return of a
bi-polar world but with significant differences in the goals of the
powers—JM]
e) the excess expected returns of bonds is compressing relative to the returns on the cash rates central banks are providing.
As for monetary policy and fiscal policy responses, it seems to me that we
are classically in the late stages of the long-term debt cycle when
central banks’ power to ease in order to reverse an economic downturn is
coming to an end because:
Monetary Policy 1 (i.e. the ability to lower interest rates) doesn’t
work effectively because interest rates get so low that lowering them
enough to stimulate growth doesn’t work well,
Monetary Policy 2 (i.e. printing money and buying financial assets)
doesn’t work well because that doesn’t produce adequate credit in the
real economy (as distinct from credit growth to leverage up investment
assets), so there is “pushing on a string.†That creates the need for…
Monetary Policy 3 (large budget deficits and monetizing of them)
which is problematic especially in this highly politicized and
undisciplined environment.
More specifically, central bank policies will push short-term
and long-term real and nominal interest rates very low and print money
to buy financial assets because they will need to set
short-term interest rates as low as possible due to the large debt and
other obligations (e.g. pensions and healthcare obligations) that are
coming due and because of weakness in the economy and low inflation.
Their hope will be that doing so will drive the expected returns of cash
below the expected returns of bonds, but that won’t work well because:
a) these rates are too close to their floors,
b) there is a weakening in growth and inflation expectations which is also lowering the expected returns of equities,
c) real rates need to go very low because of the large debt and other obligations coming due, and
d) the purchases of financial assets by central banks stays in the
hands of investors rather than trickles down to most of the economy
(which worsens the wealth gap and the populist political responses).
This has happened at a time when investors have become increasingly leveraged long due to the low interest rates and their increased liquidity. As a result we see the market driving down short-term rates while central
banks are also turning more toward long-term interest rate and yield
curve controls, just as they did from the late 1930s through most of the
1940s.
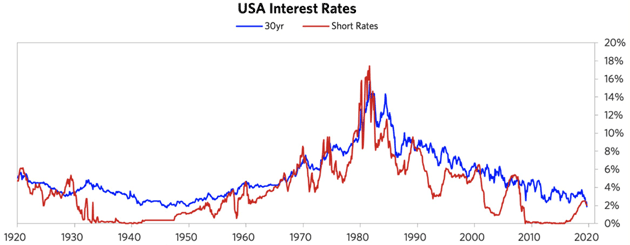
To put this interest rate situation in perspective, see the long-term
debt/interest rate wave in the following chart. As shown below, there
was a big inflationary blow-off that drove interest rates into a
blow-off in 1980–82. During that period, Paul Volcker raised real and
nominal interest rates to what were called the highest levels “since the
birth of Jesus Christ,†which caused the reversal.
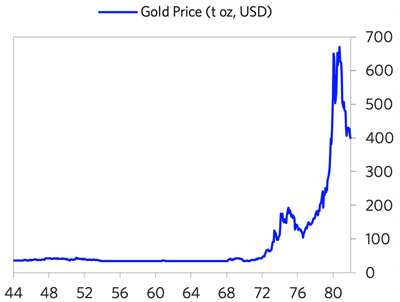
During the period leading into the 1980–82 peak, we saw the blow-off
in gold. The below chart shows the gold price from 1944 (near the end of
the war and the beginning of the Bretton Woods monetary system) into
the 1980–82 period (the end of the inflationary blow-off). Note that the
bull move in gold began in 1971, when the Bretton Woods monetary system
that linked the dollar to gold broke down and was replaced by the
current fiat monetary system. The de-linking of the dollar from gold set
off that big move. During the resulting inflationary/gold
blow-off, there was the big bear move in bonds that reversed with the
extremely tight monetary policies of 1979–82.
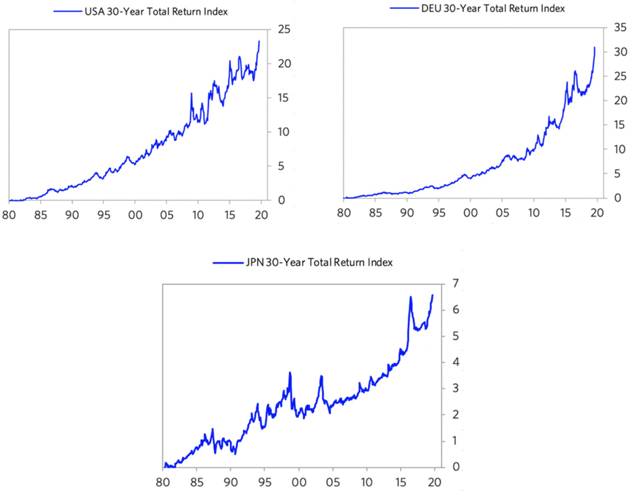
Since then, we have had a mirror-like symmetrical reversal (a dis/deflationary blow-off). Look
at the current inflation rates at the current cyclical peaks (i.e. not
much inflation despite the world economy and financial markets being
near a peak and despite all the central banks’ money printing) and
imagine what they will be at the next cyclical lows. That is because there
are strong deflationary forces at work as productive capacity has
increased greatly. These forces are creating the need for extremely
loose monetary policies that are forcing central banks to drive interest
rates to such low levels and will lead to enormous deficits that are
monetized, which is creating the blow-off in bonds that is the
reciprocal of the 1980–82 blow-off in gold. The charts below show the 30-year T-bond returns from that 1980–82 period until now, which highlight the blow-off in bonds.
To understand the current period, I recommend that you understand the
workings of the 1935–45 period closely, which is the last time similar
forces were at work to produce a similar dynamic.
Please understand that I’m not saying that the past is
prologue in an identical way. What I am saying that the basic
cause/effect relationships are analogous:
a) approaching the ends of the short-term and long-term debt cycles, while
b) the internal politics is driven by large wealth and political
gaps, which are producing large internal conflicts between the rich and
the poor and between capitalists and socialists, and
c) the external political conflict that is driven by the rising of an
emerging power to challenge the existing world power, leading to
significant external conflict that eventually leads to a change in the
world order.
As a result, there is a lot to be learned by understanding the mechanics of what happened then (and in other analogous times before then) in order to understand the mechanics of what is happening now.
It is also worth understanding how paradigm shifts work and how to diversify well to protect oneself against them.
by Ray Dalio, Bridgewater Associates, August 28, 2019
Posted by AGORACOM
at 9:45 PM on Tuesday, September 10th, 2019
SPONSOR: Advance Gold AAX.v – Advance Gold controls 100% interest in the Tabasquena Silver Mine in Zacatecas, Mexico. A cluster of 30 Epithermal veins have been discovered, with recent emphasis on exploring a large anomaly to drill. Advance also owns 15% of the Kakamega JV attached to Barrick Takeover Offer for Acacia Mining. Click Here For More Info
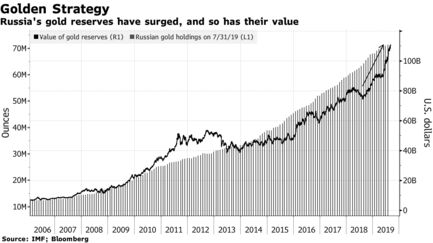
Value of Russia’s gold reserves climbed 42% in the past year
Russia is diversifying from U.S. assets and gold has rallied
Russia’s long-running bet on gold is looking better every month.
The
country quadrupled gold reserves in the past decade as it diversified
away from U.S. assets, a move that has paid off recently as haven demand
sent prices to a six-year high. In the past year, the value of the
nation’s gold jumped 42% to $109.5 billion and the metal now makes up the biggest share of Russia’s total reserves since 2000.
Russia’s central bank has been the largest buyer of gold in
the past few years as President Vladimir Putin seeks to break reliance
on the U.S. dollar as relations between the countries remain strained.
If Russia did need to tap its gold holding, it would fetch a hefty price
— the metal is heading for the best year since 2010 as the U.S.-China
trade war hurts global growth and central banks ease monetary policy.
“Russia
prefers to cushion its macroeconomic stability through politically
neutral tools,†said Vladimir Miklashevsky, a strategist at Danske Bank
A/S in Helsinki. “There is a massive substitution of U.S. dollar assets
by gold — a strategy which has earned billions of dollars for the Bank
of Russia just within several months.â€
More on Russia’s reserves
Russia’s
gold reserves total more than 2,200 tons, the fifth-biggest hoard by
country, and gold now accounts for 20.7% of overall reserves.The value of Russia’s currency reserves are up 9.5% in the past year, lagging the gains seen in bullion.The
central bank bought about 106 tons so far this year, the latest data
show. That’s down 19% from the same period in 2018 but still more than
any other nation.Last year, Russia’s gold buying exceeded its mine supply for the first time.
Russia
isn’t alone in hoarding gold. China, Kazakhstan and Poland have been
among the biggest buyers in the past couple of years, and global
holdings are expected to increase for a while yet.
Not all of Russia’s moves are paying off. Last year, the central bank shifted
about $100 billion of U.S. holdings into euros, yuan and the yen, and
since then the Chinese currency has dropped. Russia also missed out on
the rally in U.S. Treasuries.
Russia may keep buying gold to compensate for those other
losses in its reserves, said Kirill Tremasov, a former Economics
Ministry official and now director of analysis at Loko-Invest in Moscow.
So far it’s working, with gold up 18% this year to $1,513 an ounce.
For
Russia at least, it’s more about diversification than benefiting from
the price. The central bank started buying gold more than a decade ago
as it rallied toward 2011‘s record, and kept adding when prices dropped
in the following few years.
“The central bank is unlikely to have
pursued the goal of earning in the process of managing gold reserves,â€
Dmitry Dolgin, an economist at ING Bank, said by email. “The buying was
rather about diversification of assets
Posted by AGORACOM
at 9:50 AM on Monday, September 9th, 2019
SPONSOR: Advance Gold AAX.v – Advance Gold controls 100% interest in the Tabasquena Silver Mine in Zacatecas, Mexico. A cluster of 30 Epithermal veins have been discovered, with recent emphasis on exploring a large anomaly to drill. Advance also owns 15% of the Kakamega JV attached to Barrick Takeover Offer for Acacia Mining. Click Here For More Info
China has added almost 100 tons of gold to its reserves since it resumed buying in December
People’s Bank of China raised bullion holdings to 62.45 million ounces in August from 62.26 million a month earlier
Terms of Trade is a daily newsletter that untangles a world embroiled in trade wars. Sign up here.Â
China
has added almost 100 tons of gold to its reserves since it resumed
buying in December, with the consistent run of accumulation coming amid a
rally in prices and the drag of the trade war with Washington.
The
People’s Bank of China raised bullion holdings to 62.45 million ounces
in August from 62.26 million a month earlier, according to data on its
website at the weekend. In tonnage terms, August’s inflow was 5.91 tons,
following the addition of about 94 tons in the previous eight months.
Bullion
is near a six-year high as central banks including the Federal Reserve
cut interest rates as signs of a slowdown mount amid the U.S.-China
trade war. Central-bank purchases have been another key support for
prices as authorities from China to Russia accumulate significant
quantities of bullion to help diversify their reserves. That buying
spree likely to persist in the coming years, according to Australia
& New Zealand Banking Group Ltd.
Trade
war restrictions, in the case of China, or sanctions, as with Russia,
give “an incentive for these central banks to diversify,†John Sharma,
an economist at National Australia Bank Ltd., said in an email. “Also,
with increasing political and economic uncertainty prevailing, gold
provides an ideal hedge, and will therefore be sought after by central
banks globally.â€
China
has previously gone long periods without revealing increases in gold
holdings. When the central bank announced a 57% jump in reserves to 53.3
million ounces in mid-2015, it was the first update in six years.
Spot
gold rose 0.2% to $1,510.27 an ounce on Monday. Prices, which capped a
fourth straight monthly gains in August, have risen 18% this year.
Goldman Sachs Group Inc. and BNP Paribas SA are among banks that expect
the metal to challenge $1,600 an ounce within the coming months.


